Weather has dominated the natgas headlines with Nov and Dec realizing to be warm at the national level. The following two weather maps put everything we need to know into perspective.
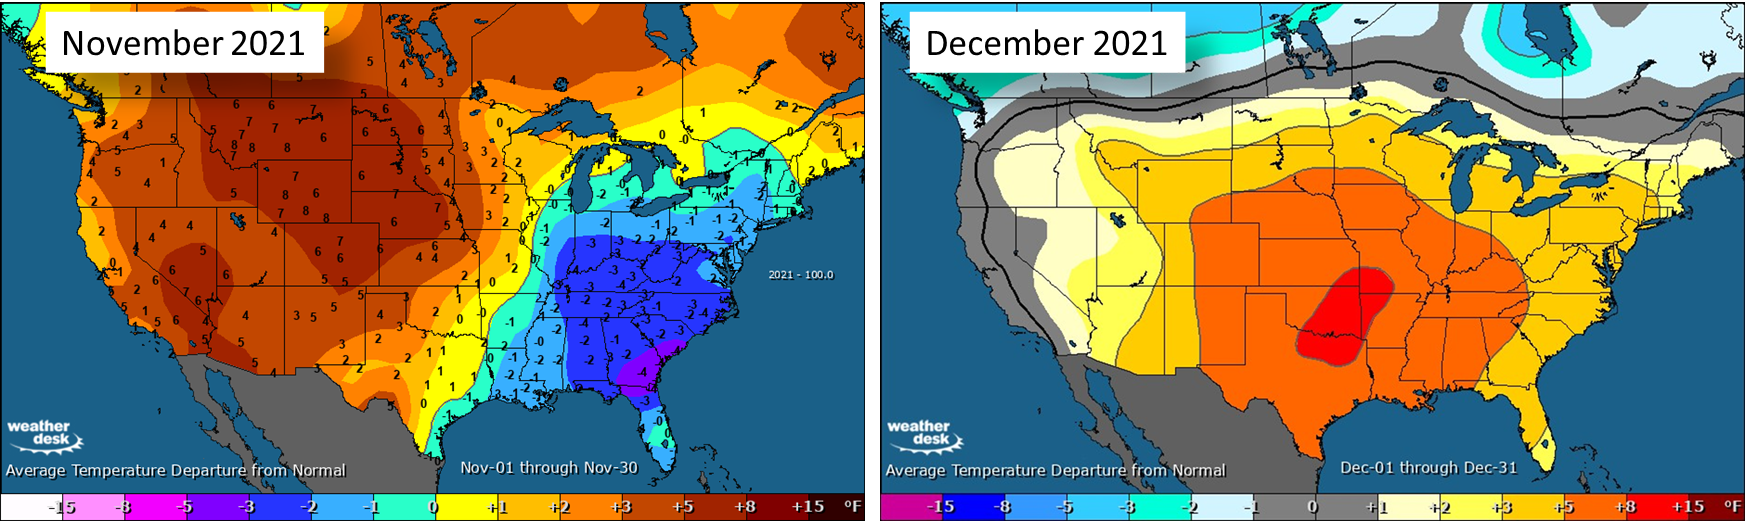
Source: Maxar Weather, enelyst.com
We had a hunch that weather would play a key role in price direction based on where storage levels were at the end of Oct (more that years where storage finishes above the 5Yr Avg). Starting mid-summer, the balances started pointing to very tight conditions and as a result, natgas was trading at a premium to encourage more production and reduced power burns.
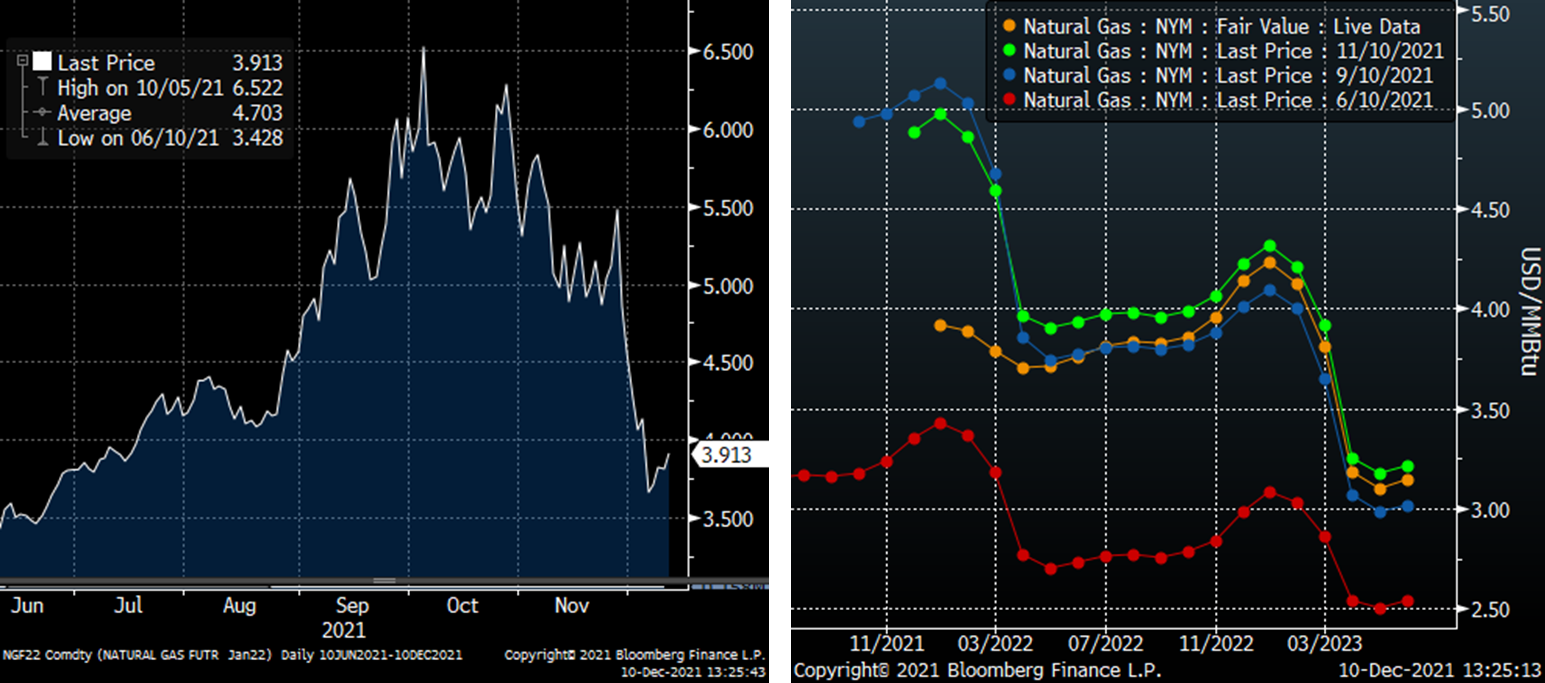
Now that winter has had an extremely warm start (Nov warmer that the 10Y, and Dec on record to be the 2nd warmest in the past 50 years), the market has sold off quickly. Here are a couple of quick charts showing prompt and the term structure has changed over the past 6 months.
As part of today’s report, we try to put some numbers around this weather move. By our calculation, the current warmer-than-normal weather shows 128 fewer HDDs between Nov 7th and Dec 24th than we would have seen with 10Y normal weather [Friday’s 00z gives us visibility to Dec 24th]. This has resulted in rescomm demand lower by 168 Bcf [RC Demand: 1719 Bcf with 10Y normal weather & 1551 Bcf with Actuals + 15D forecast].
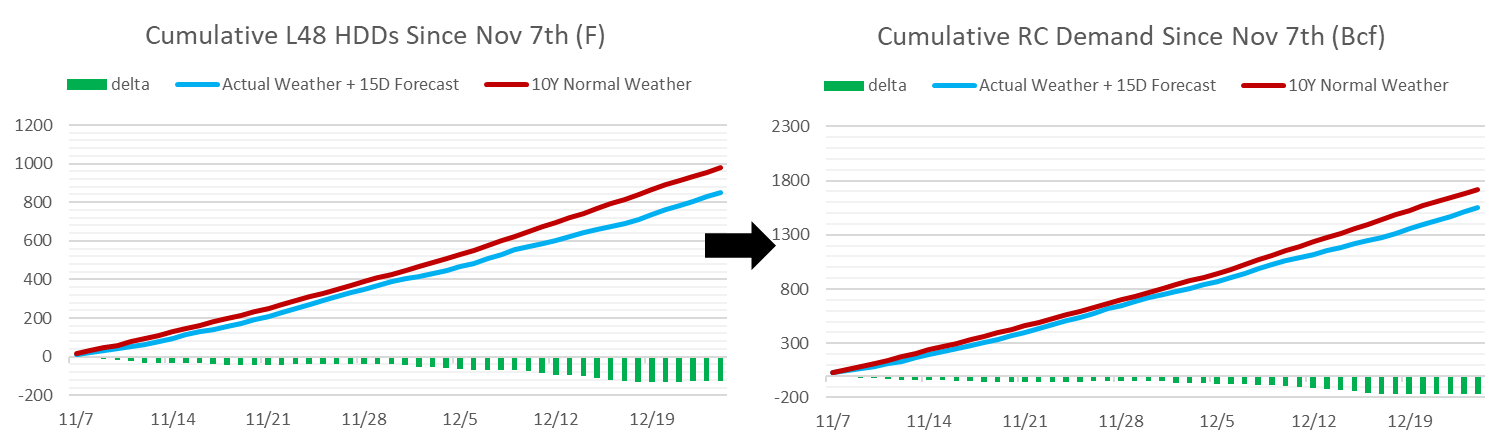
Note:
1) This does not take into consideration the lower industrial demand or reduced production freeze-off that also adds to the bearish tone. So it’s fair to say that weather has added at least 168 Bcf to the end of March storage forecasts made before the start of winter.
2) We only have visibility to ~40% of winter days so far, and therefore there is still the opportunity for much cooler or warmer days ahead. Even though the market looks to have written of this winter, there is still a lot of time left for some variability.
This takes us to the next part of our report where we go through a simple quantitative exercise to see how the daily 15D forecast has impacted price this winter so far. Please treat this analysis as only a simplistic approach to understanding the daily weather factor on price change.
Starting the first Monday of November we calculated the expected total HDDs between Nov 1st to Dec 31st. Each week going forward, we compared the total HDD for that same time range (61 days) and compared it to the closing price for that day. So the assumption is that the daily temp change gets embedded into price by end of day.
Total HDD = historical HDDs + the expected from the the Euro Ensemble 15D + the 10Y normal

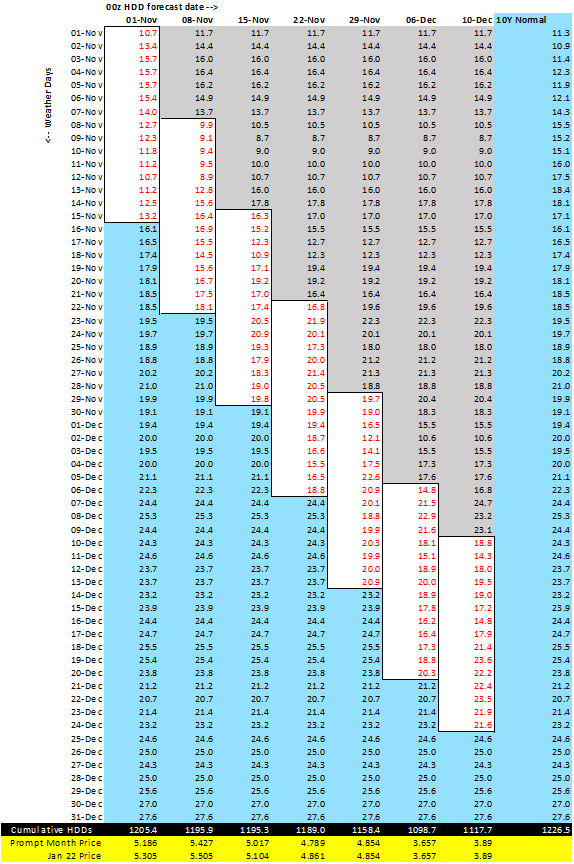
When we chart the Total HDDs (for that 61 day strip) from each week against the closing daily price, we see a strong relationship that roughly translates into each change in HDD equating to a ~1.6c price move.
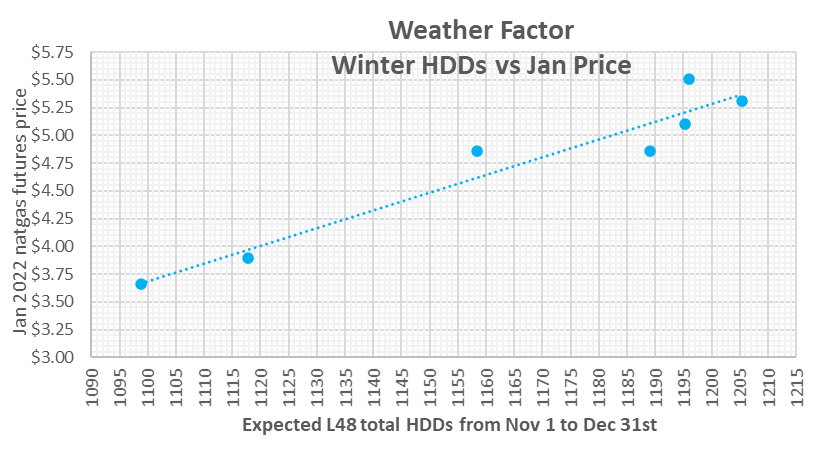
Note: There is some noise to this analysis because many fundamental factors influence the daily price change such as production levels, LNG feedgas levels, change in power burn levels with changing price, and longer range weather forecasts. Please use this only for informational purposes.
Fundamentals for the week ending Dec 10:
The EIA reported a +59 Bcf withdrawal for the week ending Dec 3rd, which was a repeat from last week. That does not happen too often. The regional storage estimates were quite different week-on-week, but the repeat at the national level was pure coincidence. The fundamental components looked to have canceled each out perfectly.
Relative to last week:
1) this past reporting periods’ higher production was offset by higher LNG/Mexico exports.
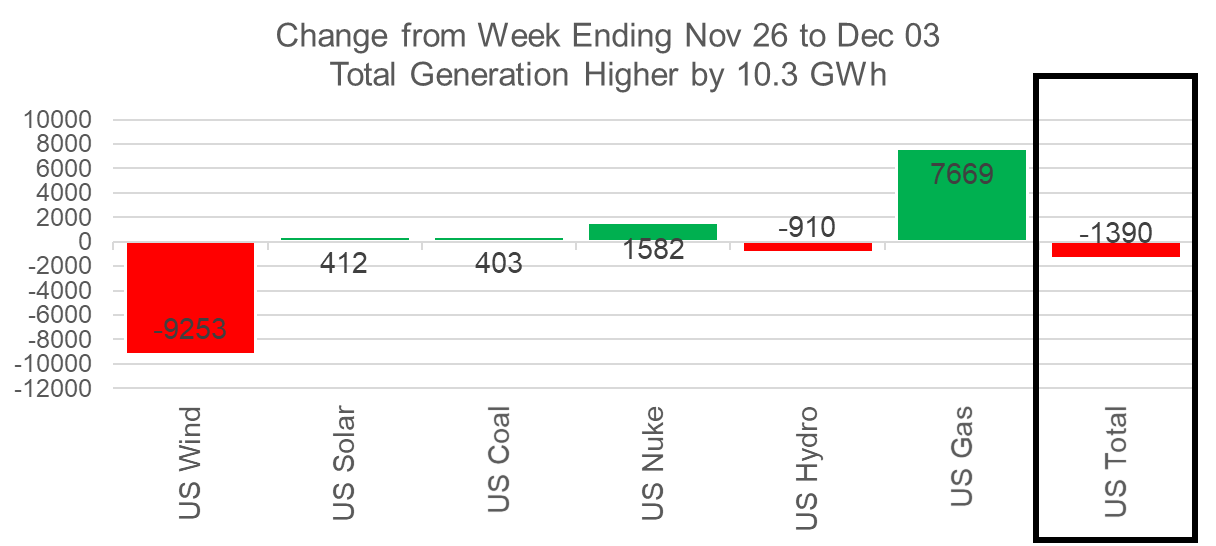
2) the lower rescomm demand due to fewer HDDs during that week was offset by strong natgas power burns due to the lower wind.
For the week ending Dec 10th, our early view is -87 Bcf. This reporting period will take L48 storage level to 3418 Bcf (-325 vs LY, -63 vs. 5Yr).
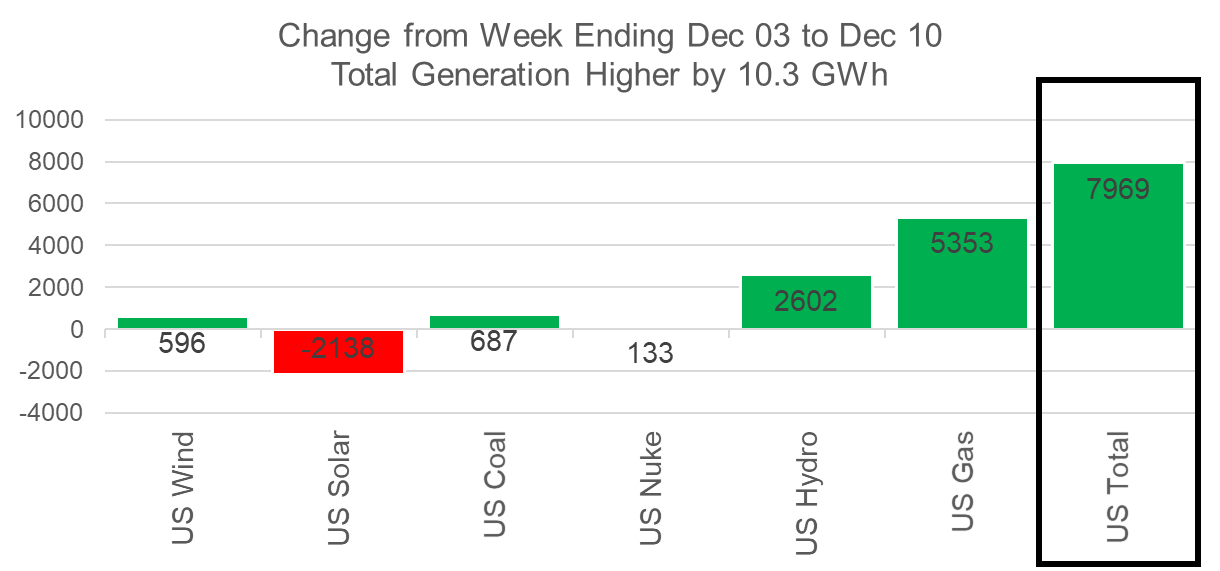
This past week we see total consumption rise with cooler temps. Total HDDs increased by 1.8F WoW leading to both rescomm and industrial demand rising by 3.5 Bcf/d WoW. Total power also looks to have risen this past week. The total US power consumption rose this week, and natgas was the dominant generation type to keep the power markets balanced. On average, natgas generation was 5.3 GWh higher which translated into roughly 1 Bcf/d of additional power burns.
Domestic dry gas production was lower by 0.2 Bcf/d to 96.7 Bcf/d. The drop is not significant and is spread across several Mountain regions (Bakken, Rockies, and Midcon); hence we attribute this small drop to slight freeze-offs in these cooler regions. As the weather continues to cool this month, we should see the freeze-off impact production. This chart from Genscape (published in their last public winter outlook) shows the estimated freeze-offs throughout the past 6 winter seasons which typically average around 0.5 Bcf/d through the winter. Winter 20/21 with winter storm Uri was an outlier.
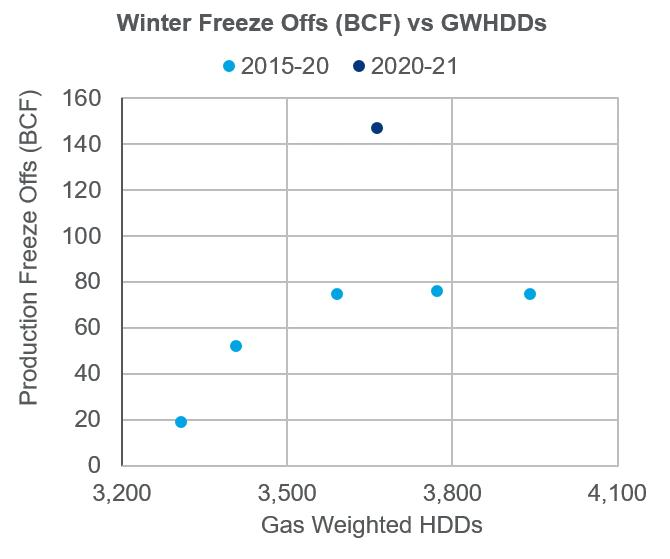
Source: Genscape Winter Outlook
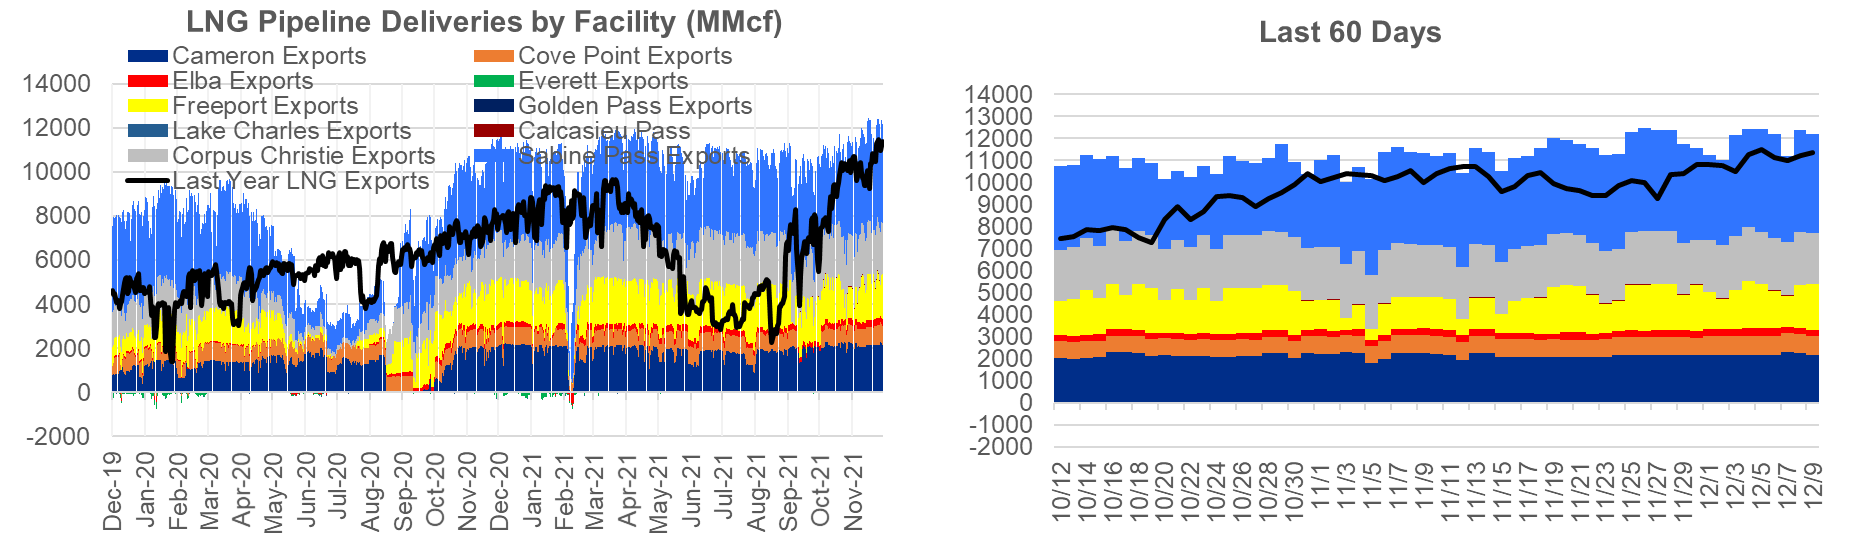
Deliveries to LNG facilities averaged 12.0 Bcf/d, which was +0.2 Bcf/d higher than last week. Volatile operations at Freeport continue, but it appears Sabine will start operating at a high level with Cheniere’s Sabine T6 now active. Cheniere loaded its first cargo from the Train 6 expansion. Feedgas was introduced in September and full commissioning is expected in Q1 2022.
The net balance was 4.4 Bcf tighter week-on-week.
Expiration and rolls: UNG ETF roll starts on Dec 15th and ends on Dec 20th.
Jan futures expire on Dec 29th, and Jan options expire on Dec 28th.
This email, any information contained herein and any files transmitted with it (collectively, the Material) are the sole property of OTC Global Holdings LP and its affiliates (OTCGH); are confidential, may be legally privileged and are intended solely for the use of the individual or entity to whom they are addressed. Unauthorized disclosure, copying or distribution of the Material, is strictly prohibited and the recipient shall not redistribute the Material in any form to a third party. Please notify the sender immediately by email if you have received this email by mistake, delete this email from your system and destroy any hard copies. OTCGH waives no privilege or confidentiality due to any mistaken transmission of this email.