This weekend’s commentary starts with a seasonal update from Brian Lovern at Bespoke Weather for our clients.
Please send any further questions/comments to brian@bespokeweather.com
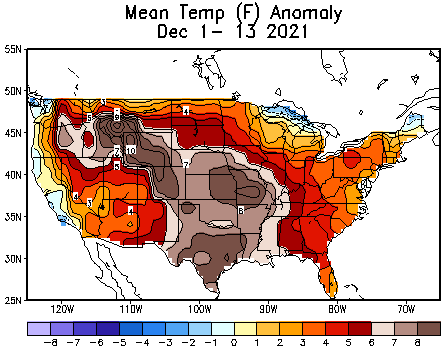
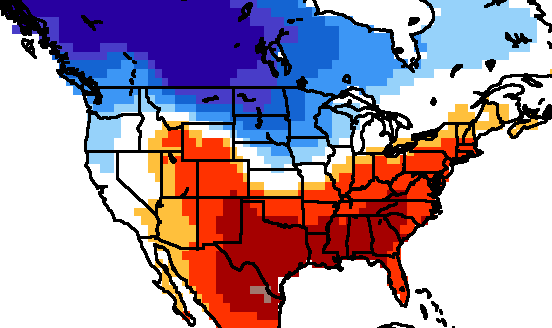
December has been quite the warm month, so far, with virtually the entire nation seeing above-normal temperatures, and a huge chunk of the nation seeing month-to-date anomalies of +5F or more. We are easily on pace for the 2nd warmest December on record, behind only December 2015.
Month-to-Date Temperature Anomalies
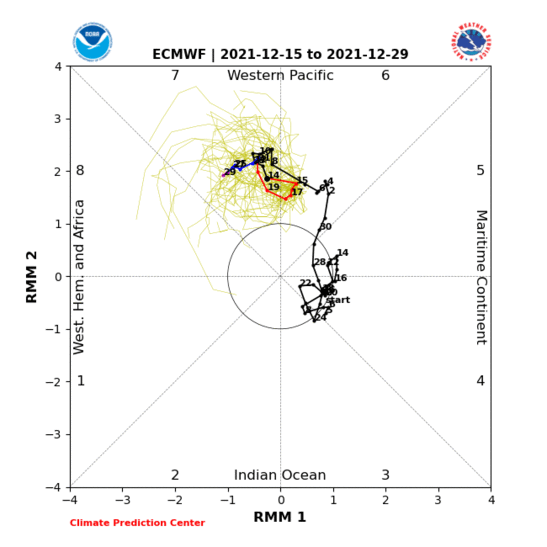
That said, we are seeing signs of a material change on the way, as forcing mechanisms shift in the coming days. The Madden-Julian Oscillation (MJO), a measure of forcing from the tropics, is set to move into phase 7, which favors colder risks, at least in the northern half of the nation, especially when in a La Niña base state, which we currently have in place.
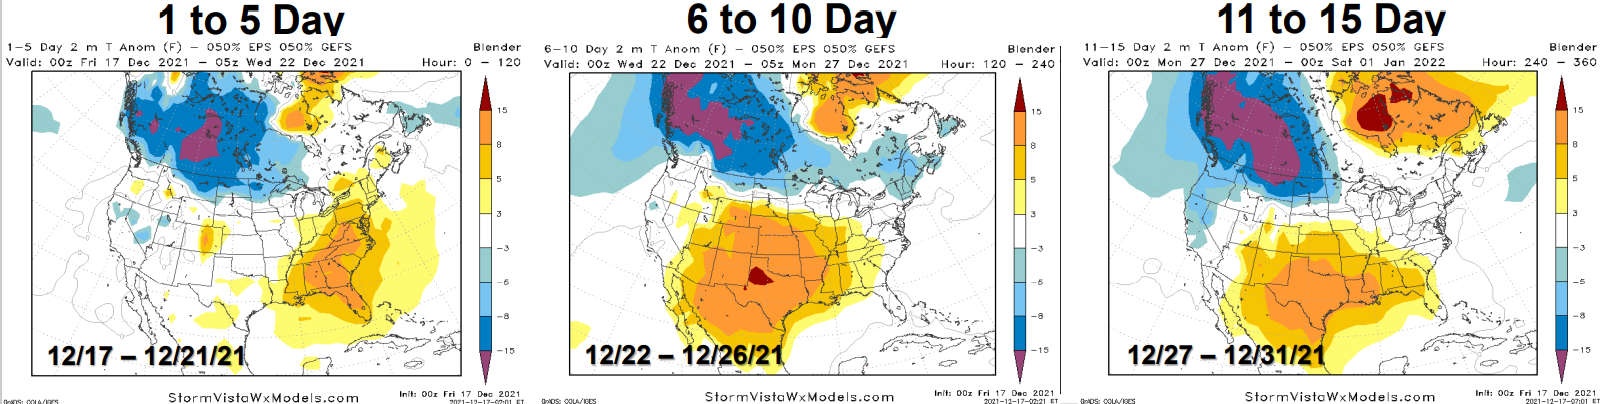
The latest forecast indeed shows such a shift, with a strong cold source up in Canada, which is able to bleed into the northern U.S. as we head into the final week to ten days of the month.
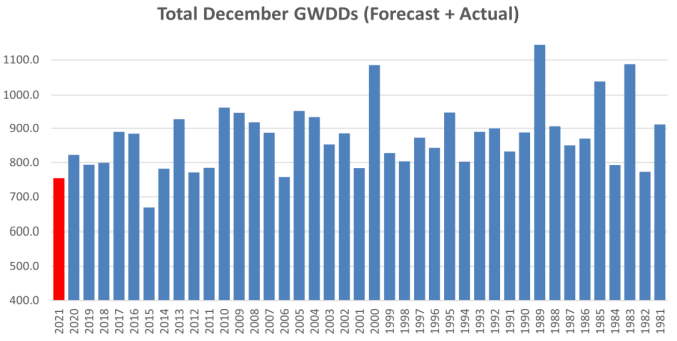
With warmth hanging on in the South, it’s not a colder-than-normal pattern on the national level, but is enough to push Gas-Weighted Degree Days (GWDDs) up toward normal, still representing quite a step change from the high-end warmth that has been dominating the pattern
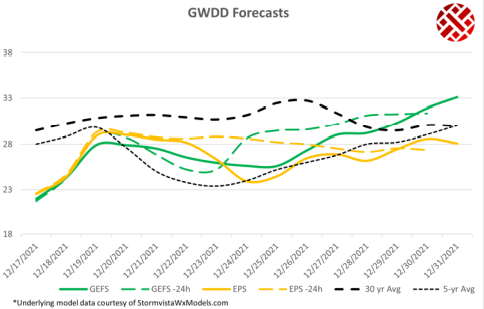
We do believe there is some risk to step colder, yet, as we end the month and head into the start of January, given the tropical forcing shift, and even some blocking that sets up in the NAO region, though we are not convinced it will rule the entire month of January. The latest CFS forecast for January actually shows more warm than cold, which can work out, but we feel the path will be such that colder risks are favored early in the month, and warmer risks later in the month. As such, expect volatility to be a theme moving forward.
For reference, the CFS’ latest January outlook:
Fundamentals for the week ending Dec 17:
The EIA reported a -88 Bcf withdrawal for the week ending Dec 10th, which was mainly in line with market estimates. Most major vendors and surveys were calling for 88-92 Bcf draw.
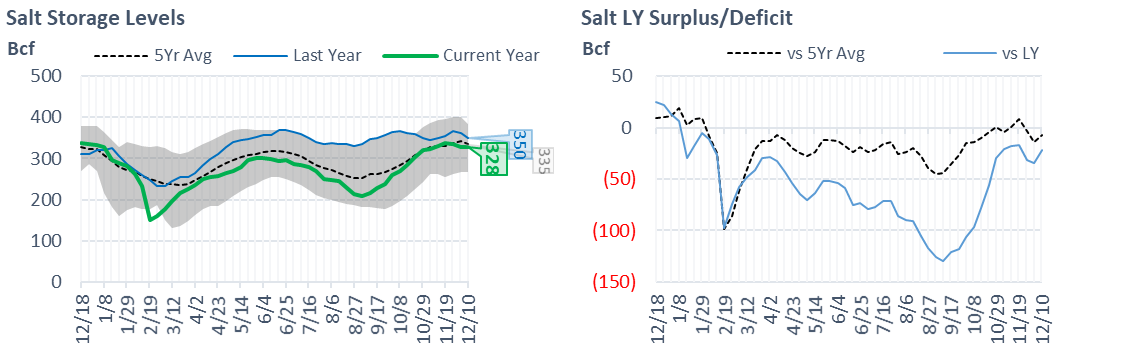
The report showed Salt storage flat for the week. Our flow models pointed to a small injection with facilities such as Pine Prairie, Moss Bluff, Bobcat, Egan, and Leaf River showing small injections. Overall, Salt Storage facilities are now sitting at 328 Bcf. With current weather outlooks, this level should assure enough daily. With less fear of running out of gas we are seeing both natgas price and vol selling off before the holidays.
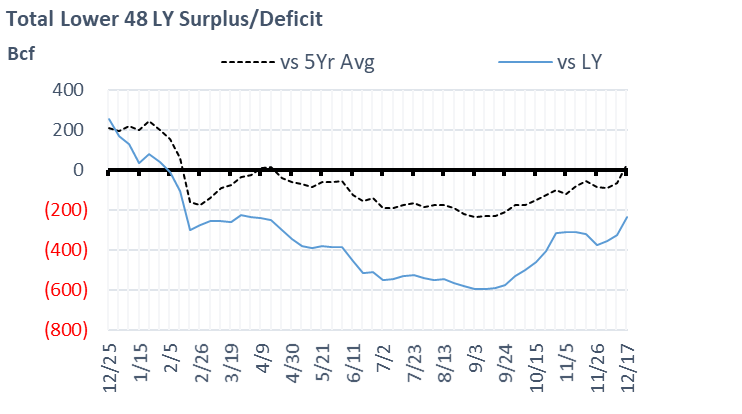
For the week ending Dec 17th, our early view is -58 Bcf. This reporting period will take L48 storage level to 3359 Bcf (-237 vs LY, +31 vs. 5Yr). With this report, we get to a level above the 5Yr average for the first time since the week ending April 16th.
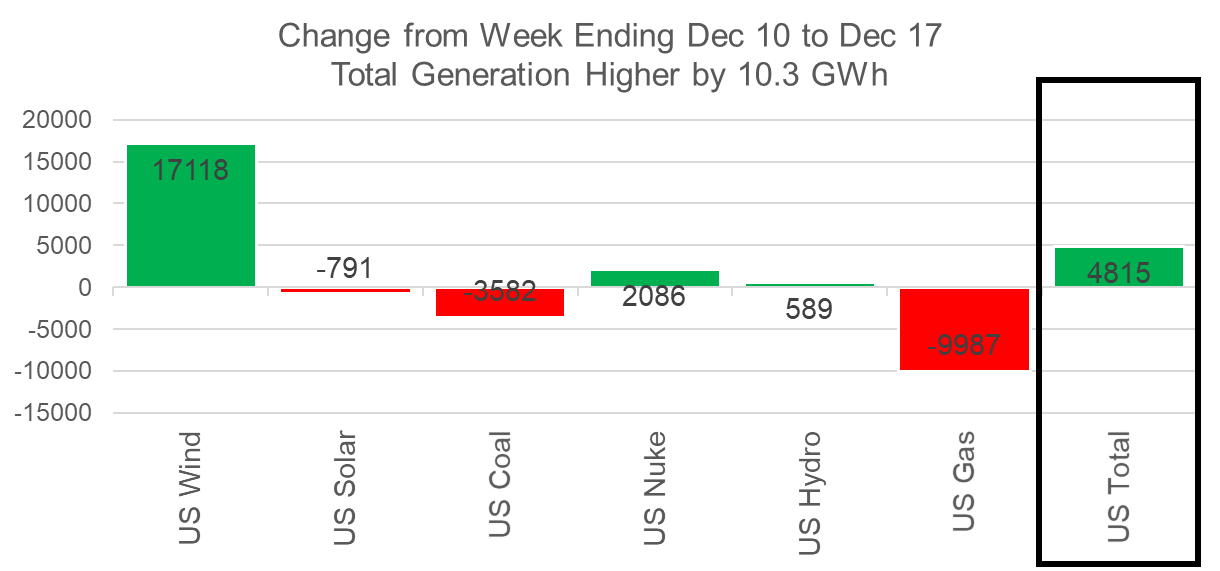
This past week we see total consumption drop considerably with warmer temps. Total HDDs decreased by 2.8F WoW leading to both rescomm and industrial demand dropping by 3.6 Bcf/d WoW. Total natgas gen also took a hit last week, despite the total power load remaining similar to the previous week. The big increase in wind and nuke generation took a bite out of natgas. Here is the L48 weekly generation change.
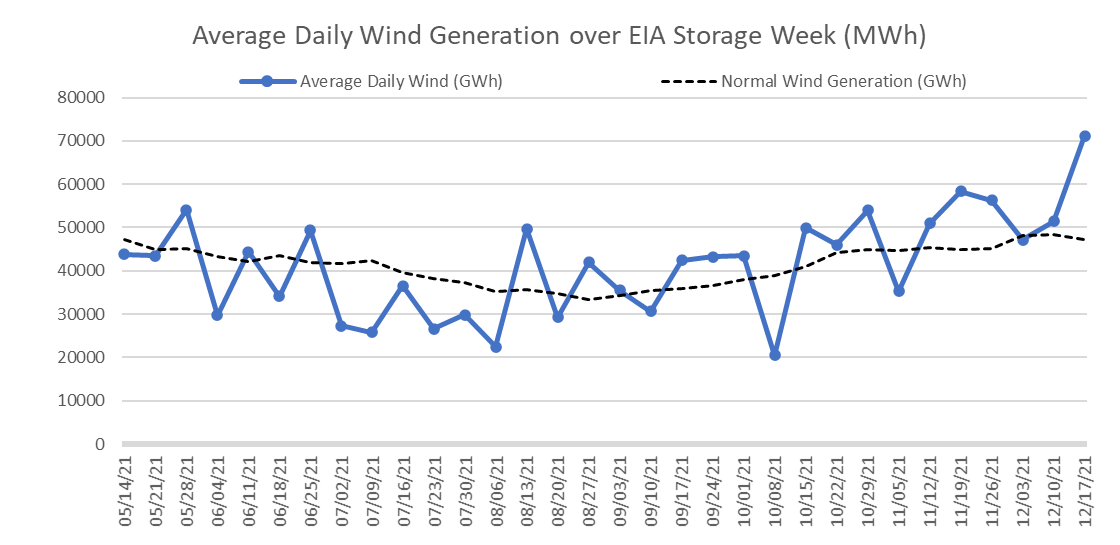
Wind generation hit a new weekly record averaging 68.5 GWh, which was 33% higher than the previous week and 51% higher than our “expected” level for this time of the year. During the summer, the big swings in wind usually led to big misses in storage reports.
Domestic dry gas production was lower by 0.3 Bcf/d to 96.5 Bcf/d. This is the 4th consecutive week where production has averaged over 96 Bcf. As we mentioned last week, we should see freeze-off impact production starting next week as weather mean-reverts to the more normal (cooler) levels.
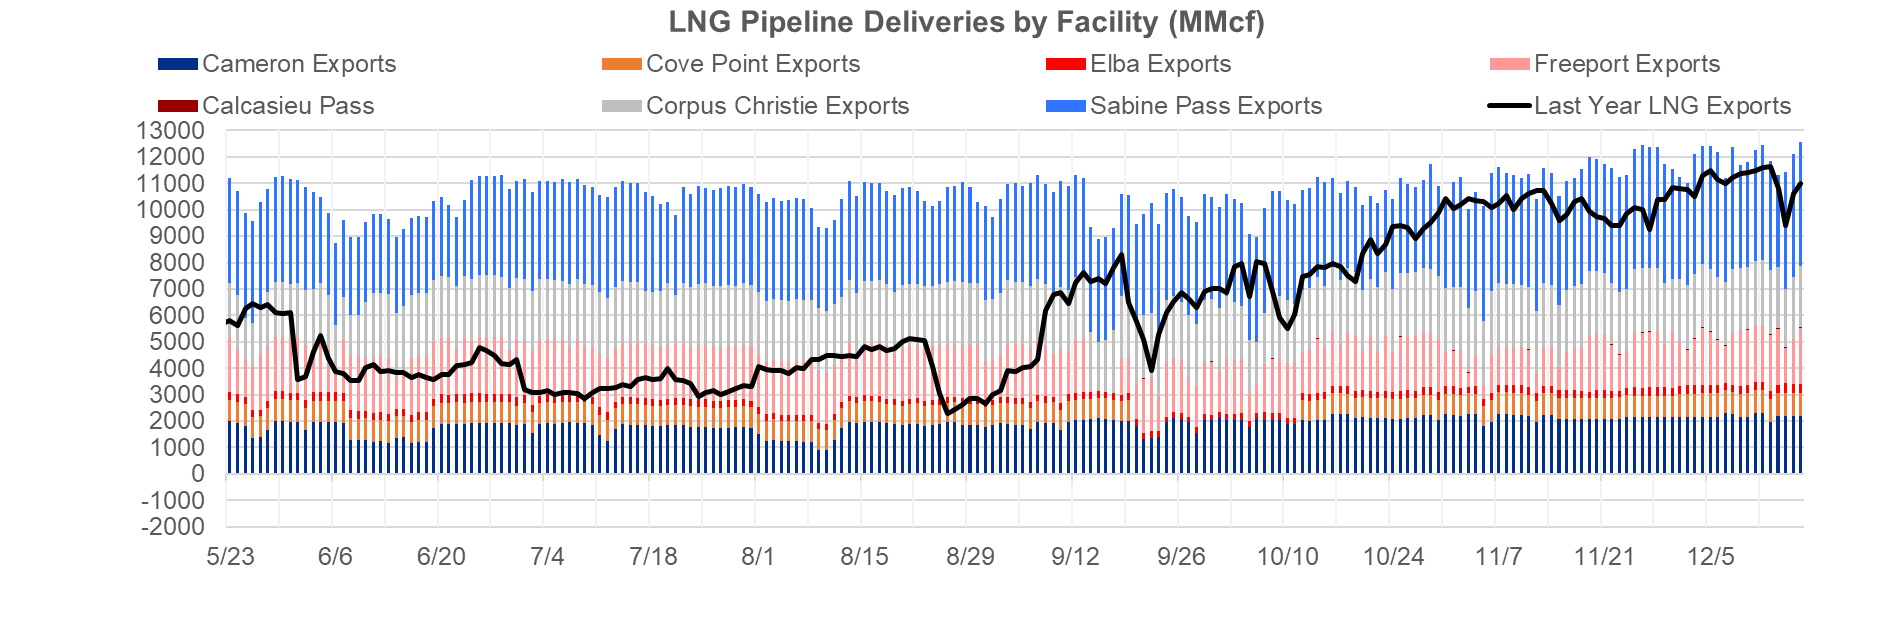
Deliveries to LNG facilities averaged 11.9 Bcf/d, which was -0.1 Bcf/d lower than last week. Operations at Sabine and Corpus Christie looked to be impacted due to fog impacting tanker arrivals midweek, but that no issues towards the end of the week. The week closed off at the strongest LNG delivery levels on record, i.e. 12.6 Bcf/d.
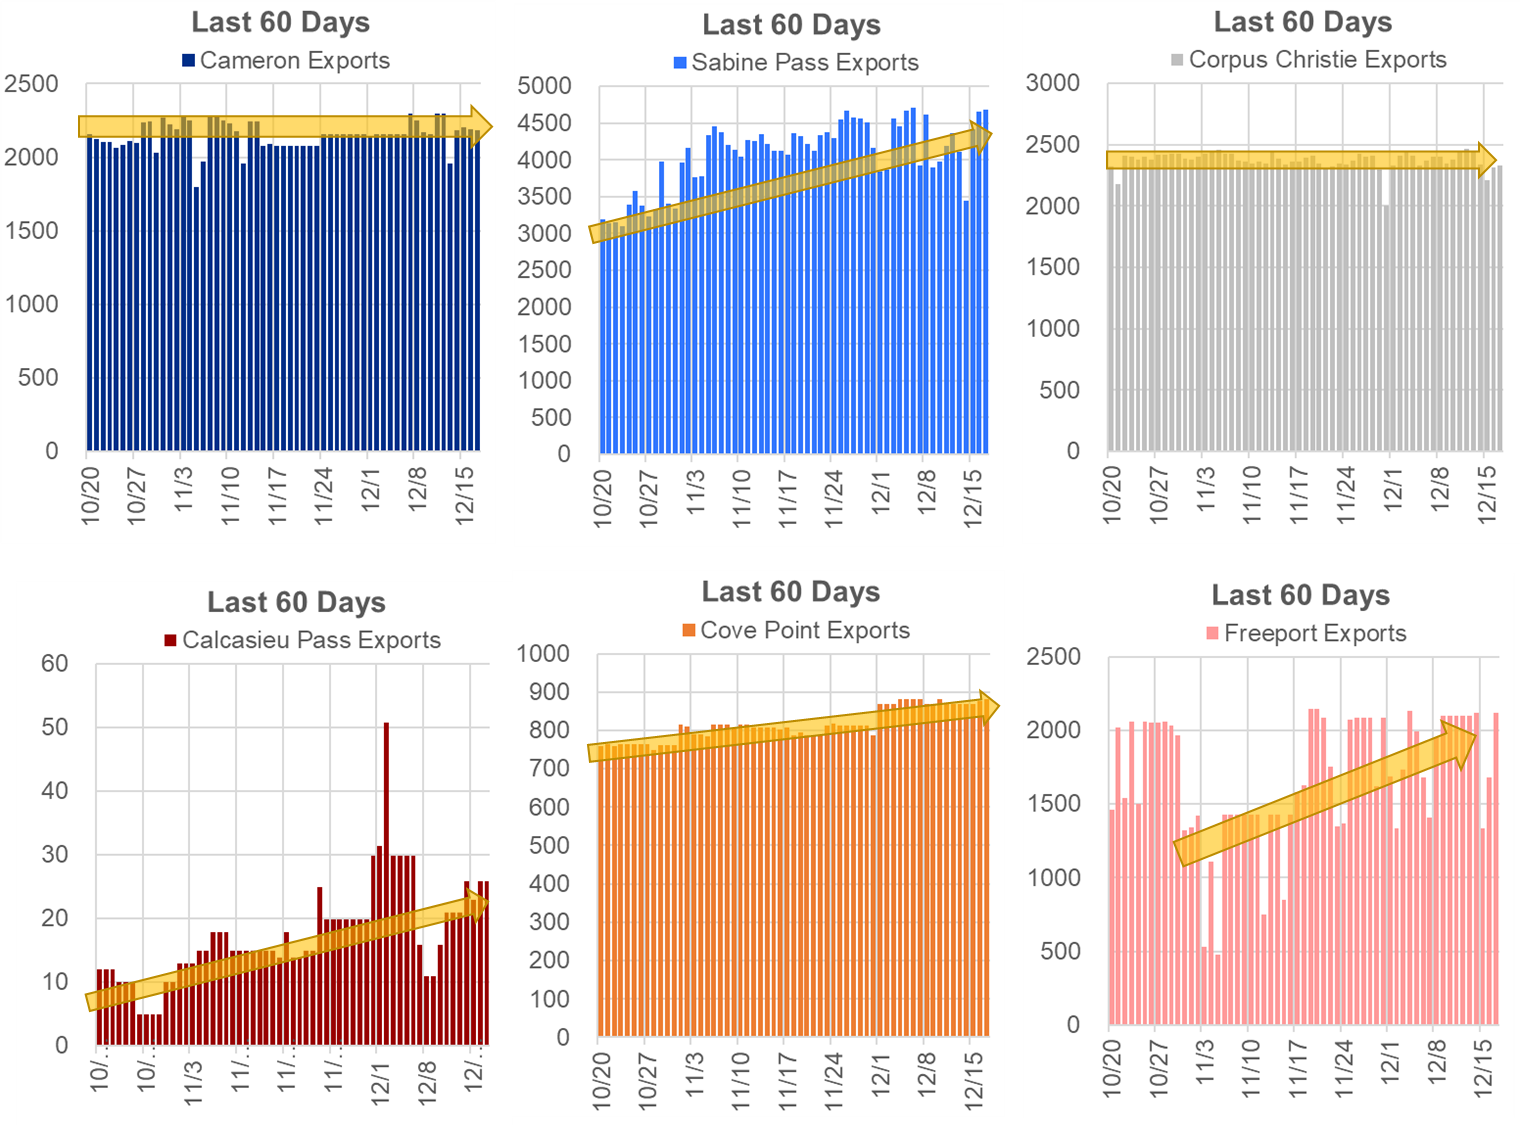
Here is the terminal-by-terminal view to see how each has operated over the past 60 days.
The net balance was 4.2 Bcf looser week-on-week.
Expiration and rolls: UNG ETF roll starts on Dec 15th and ends on Dec 20th.
Jan futures expire on Dec 29th, and Jan options expire on Dec 28th.
This email, any information contained herein and any files transmitted with it (collectively, the Material) are the sole property of OTC Global Holdings LP and its affiliates (OTCGH); are confidential, may be legally privileged and are intended solely for the use of the individual or entity to whom they are addressed. Unauthorized disclosure, copying or distribution of the Material, is strictly prohibited and the recipient shall not redistribute the Material in any form to a third party. Please notify the sender immediately by email if you have received this email by mistake, delete this email from your system and destroy any hard copies. OTCGH waives no privilege or confidentiality due to any mistaken transmission of this email.