The Russian invasion into Ukraine this past week sent energy markets soaring. It’s well known that Europe has a high reliance on Russian energy through a vast network of pipelines. Here is a clear map showing the different supply routes into Europe from a Ukrainian Think Tank. With much of it transiting through Ukraine.
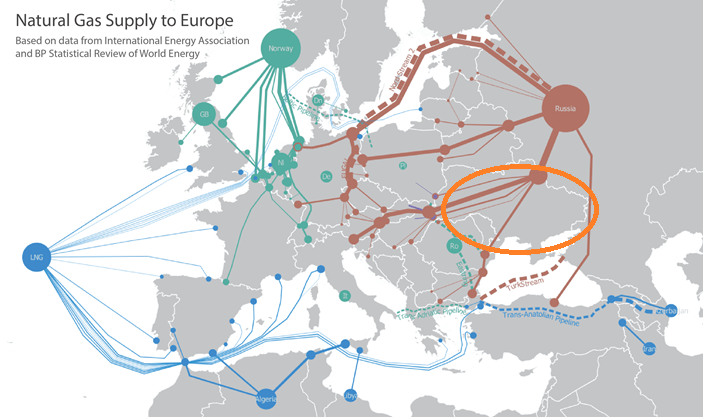
Even with the start of this war, Europe simply can’t shut Russia out. The molecules are still flowing. “In the hours after the invasion of Ukraine, there were calls for Europe to punish Russia by ending energy purchases. But the immediate response of European energy companies was to buy more natural gas, much of it transported through Ukraine’s pipeline network.” – Bloomberg
Can LNG simply replace the natural gas purchased from Russia? The simple answer is no. That being said, more US-origin LNG is headed to Europe. In December, approximately 62% of all LNG from the US went to Europe. This is the highest percentage since February 2020, as the Covid pandemic was just starting to impact European markets. According to Refinitiv, AIS ship-tracking data show that the European share of LNG has increased to 74% for January – a new high.
The chart below shows the total LNG send out into Europe and UK from all sources. As seen there was a big bump in Jan as European storage inventories dropped well below normal. Current inventories sit at 30% full, which is 8% behind last year. Ukraine inventories are also tracked, and those are sitting at 18% or 27% behind LY.
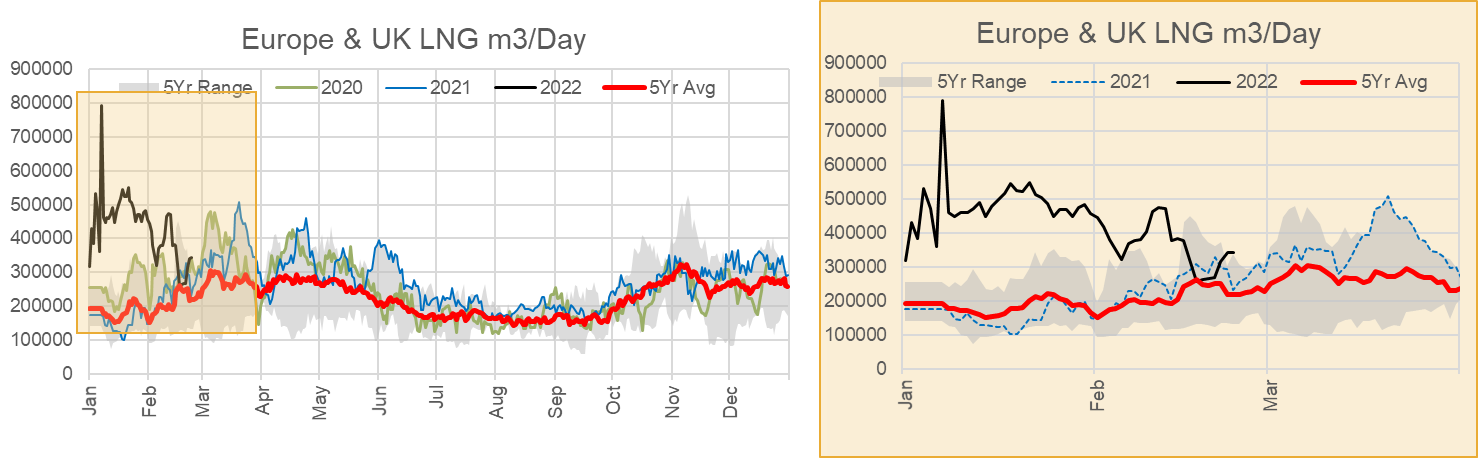
Source: Analytix.AI
With US LNG helping break the reliance on Russian natural gas, there is not much more support we can offer as current export facilities are already near their maximum capacity.
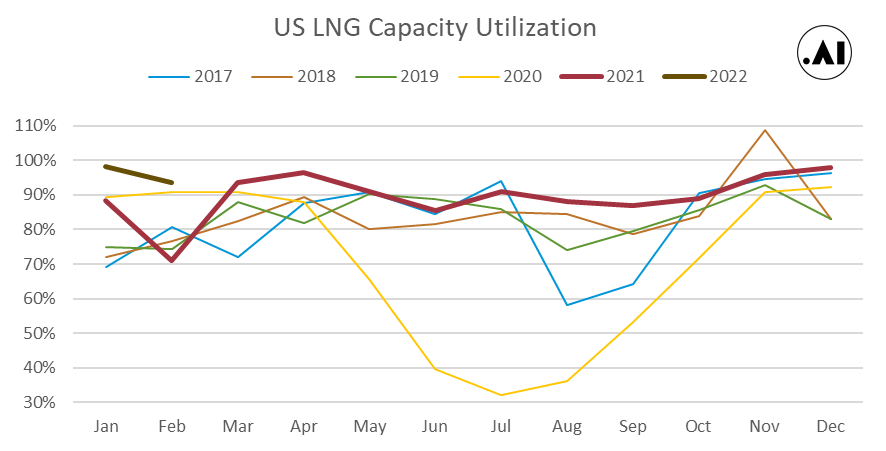
LNG Utilization over the summer generally decreases. Generally, this is true because the majority of LNG travels to Northern hemisphere destinations which rely on LNG for space heating during the winter months. Last year we saw above normal utilization that averaged 90% through the summer due to a few reasons. The first being Europe and Asia had strong demand (post-COVID) and therefore priced higher to create wide arbs to attract every possible gas molecule. The second is less maintenance with most major maintenance occurring during the 2020 COVID months when no one wanted the LNG. The 90% utilization last year could have been higher, but hurricane season usually impacts plant utilization (lower due to power issues, facility/channel damage, or disruption of tanker traffic). Here is the historical LNG plant utilization since 2017.
This coming summer, we are expecting utilization to be even higher than summer 2021. This is due to the extremely wide arbs between the US Gulf Coast and every downstream market. The Russia/Ukraine conflict has made Europe the most beneficial destination for US LNG this summer. Netback or Profits ranges from $35 to $37 for operators sending out LNG.
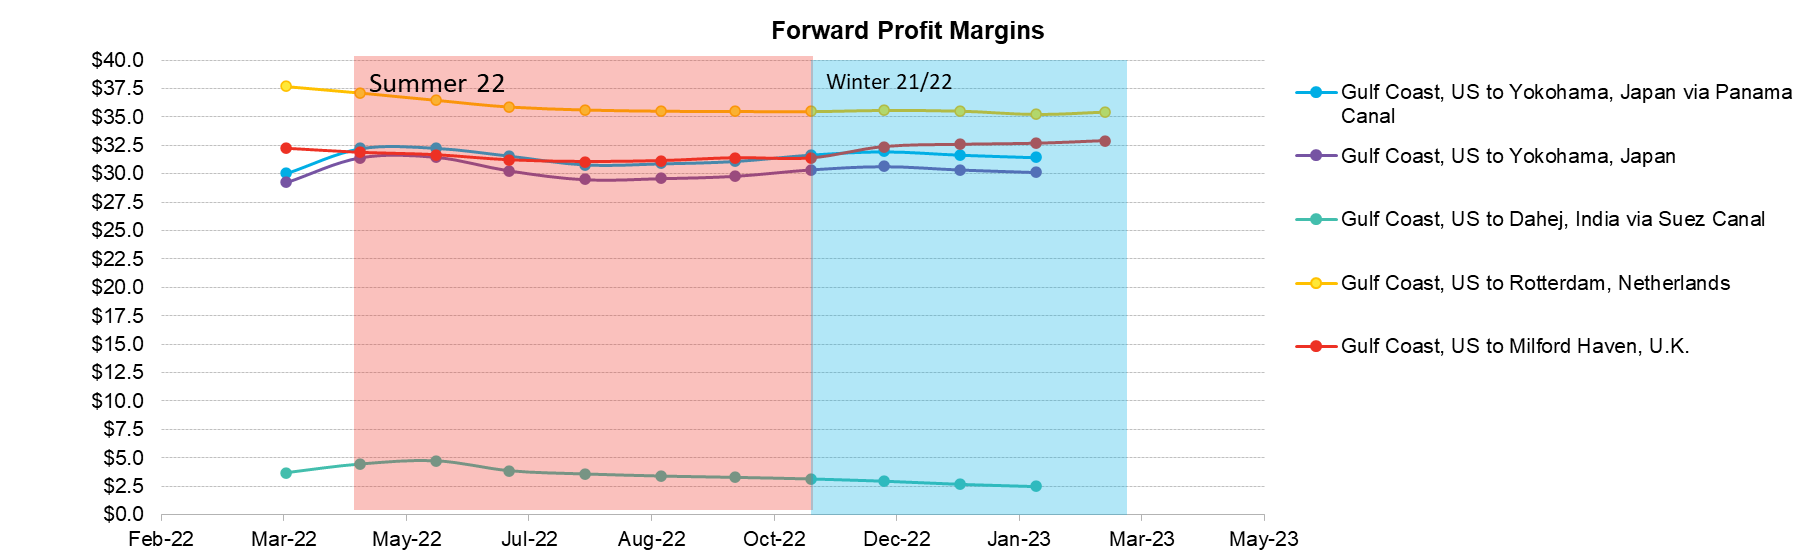
Source: Bloomberg, Analytix.AI
Assuming total LNG plant utilization sits at 92% this coming summer, we assume that total LNG deliveries will average 11.2 Bcf/d. With the added capacity for Sabine T6 (0.69 Bcf/d) and Calcasieu Pass (0.85 Bcf/d), this works out to deliveries being higher by 1.7 Bcf/d summer-on-summer.
Fundamentals for the week ending Feb 25:
The EIA reported a -129 Bcf withdrawal for the week ending Feb 18th, which came in on the high end of the estimates range.
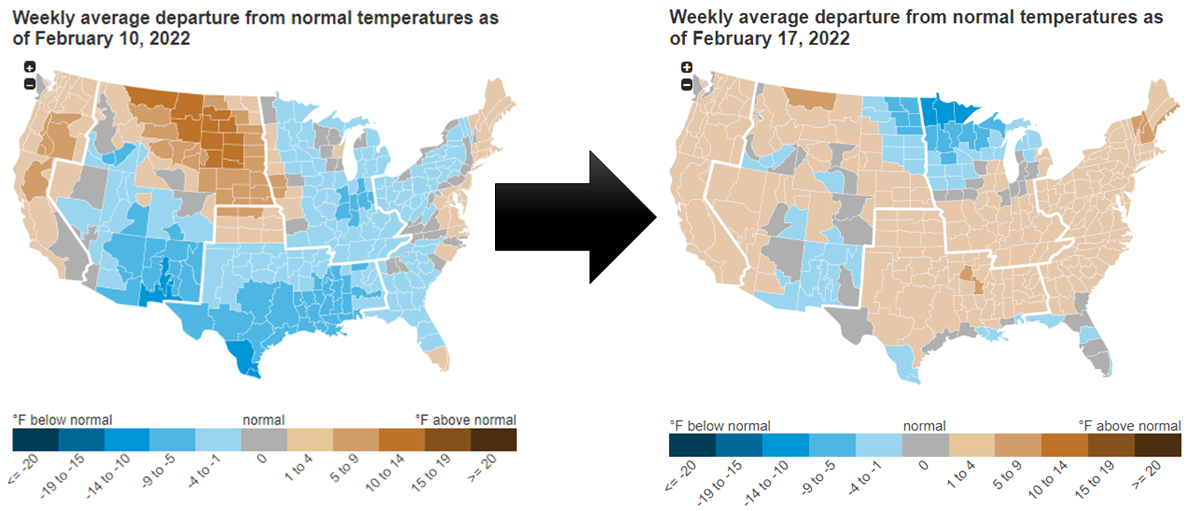
The weather made a dramatic shift to warmer than normal for most of the country. This alone helped loosen balances week-on-week by reducing overall rescomm demand by 5.5 Bcf/d.
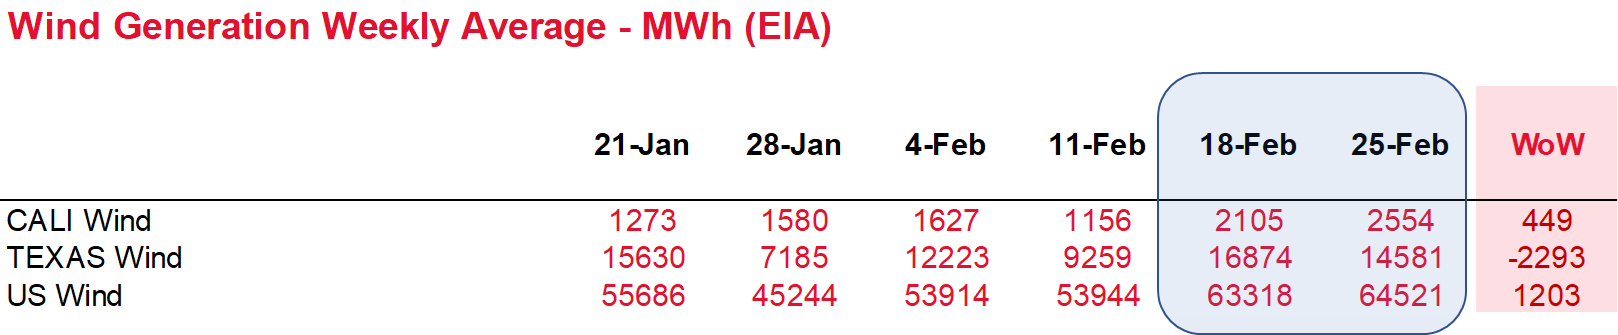
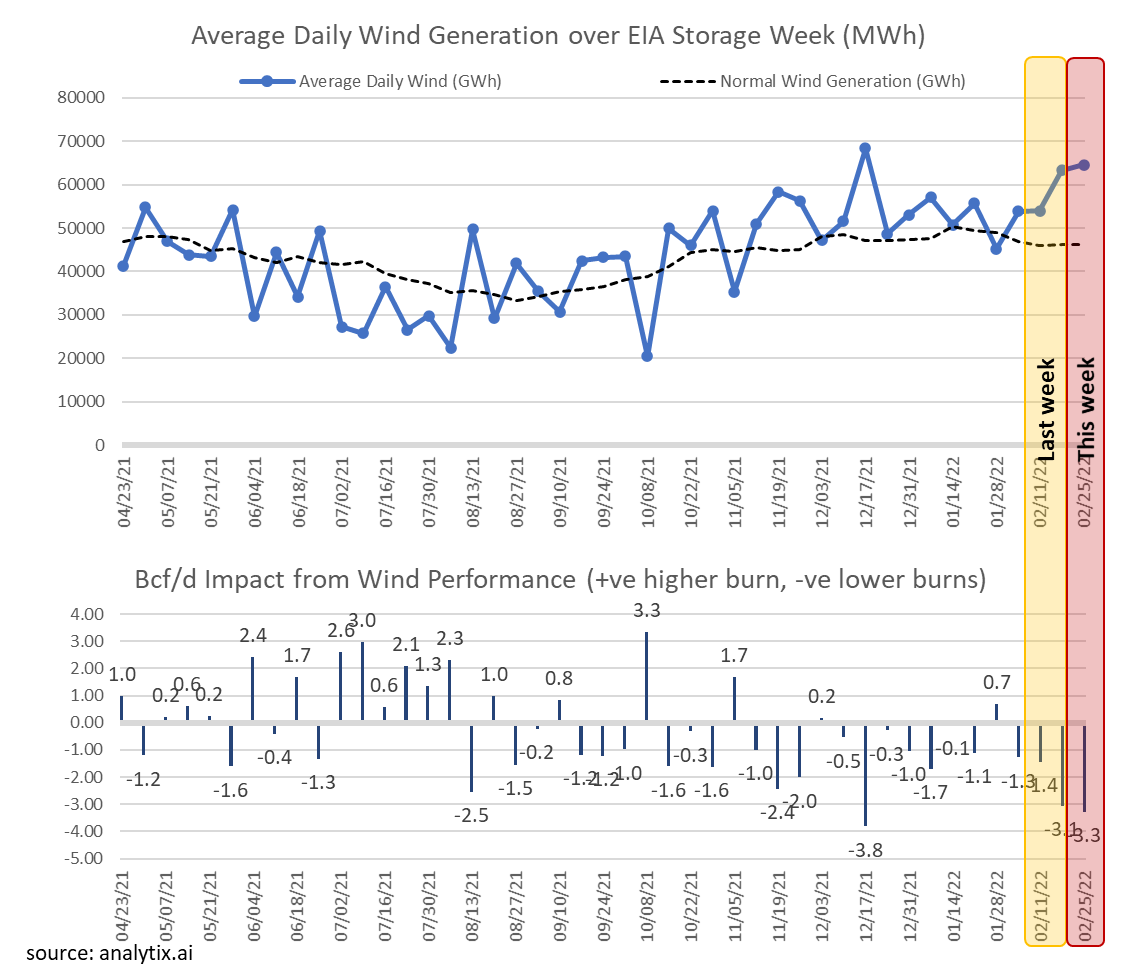
Regardless of looser conditions week-on-week, this past week’s report continues to point to the tight market conditions. We estimate this report was 2.9 Bcf/d tight vs LY (wx adjusted). This tight level benefited from very strong wind. Wind averaged 63.3 GWh on average during the week, which was 37% above normal levels based on our calculations.
Adjusting this week’s storage report to more normal wind conditions, we estimate this report was actually 6 Bcf/d tight vs LY (wx adjusted).
For the week ending Feb 25th, our early view is -126 Bcf. This reporting period will take L48 storage level to 1,656 Bcf (-466 vs LY, -367 vs. 5Yr).
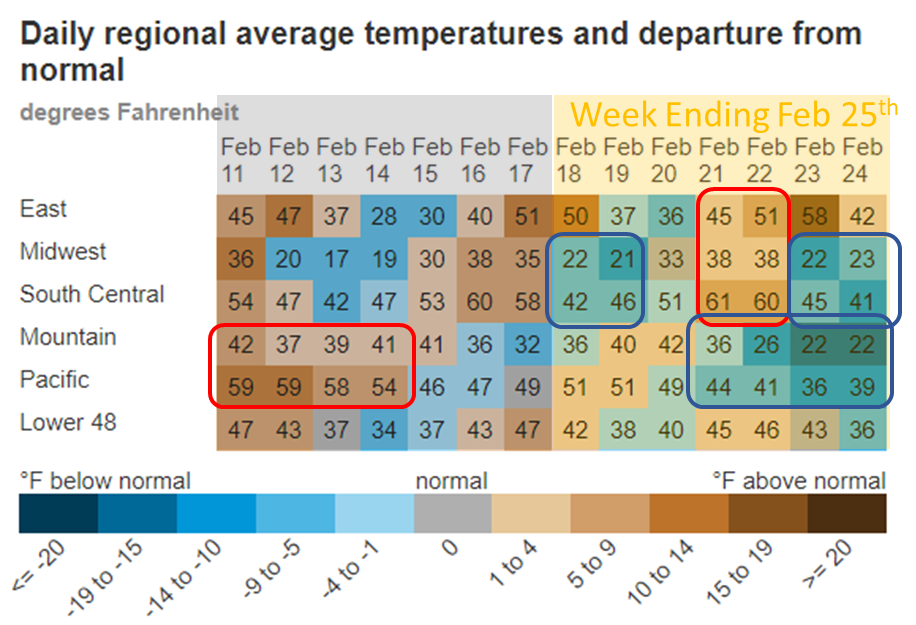
This week we see total consumption relatively flat week-on-week. Temps were generally flat at the national level, but at the regional level, we saw much volatility. The net result was L48 GWHDD increasing by a modest +1.0F relative to the previous week; resulting in a small move in total natural gas consumption for space heating.
On the power generation side, we see total burns to be consistent with last week as well. This makes sense with both temps and wind generation in the same general area as the previous week. The overall power load dropped by only 0.5% or an average of 2.3 GWh. The chart below shows the week-on-week change in the generation mix. Although it looks like there were some big shifts, it is not as the y-axis scale is quite compressed this past week.
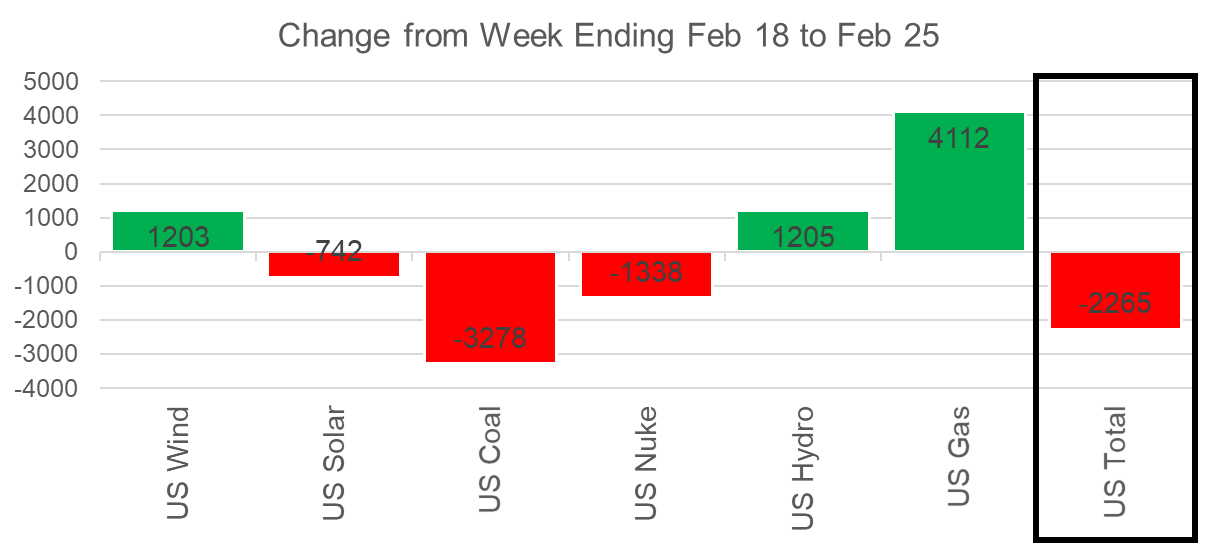
Source: Analytix.AI
As we noted above, the wind for week ending Feb 18th and Feb 25th were both very strong. In both weeks, we assume the strong wind led to power burns being ~3 Bcf/d light.
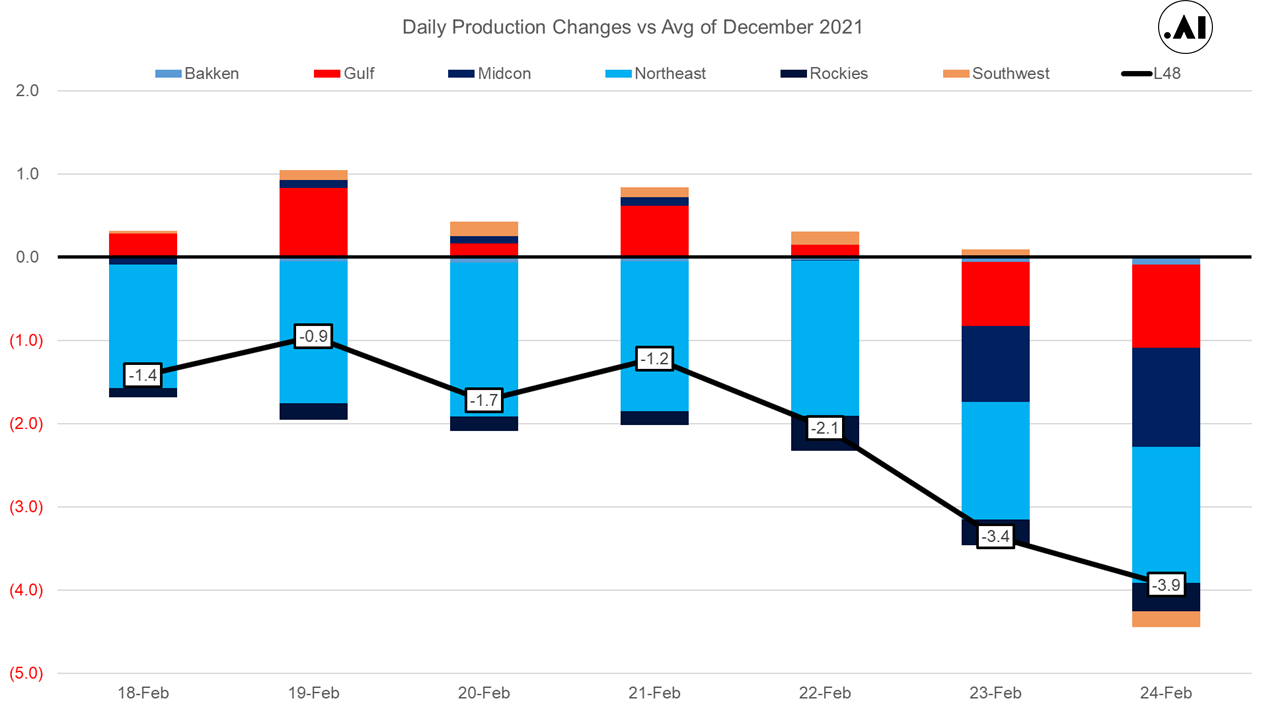
Domestic dry gas production once again fell last week due to cooler weather over key shale basins. The Permian to the Anadarko basin experienced lower production leading to overall production dropping by an average of 1.3 Bcf/d week-on-week. The latest freeze-offs add to the Northeast freeze-offs that have been in place since early Jan. The strongest levels of freeze-offs were experienced on Feb 23rd and 24th with a good portion of the US below normal temps. We expect much of the latest SC/Midcon production to resume by the end of this weekend.
Source: Analytix.AI
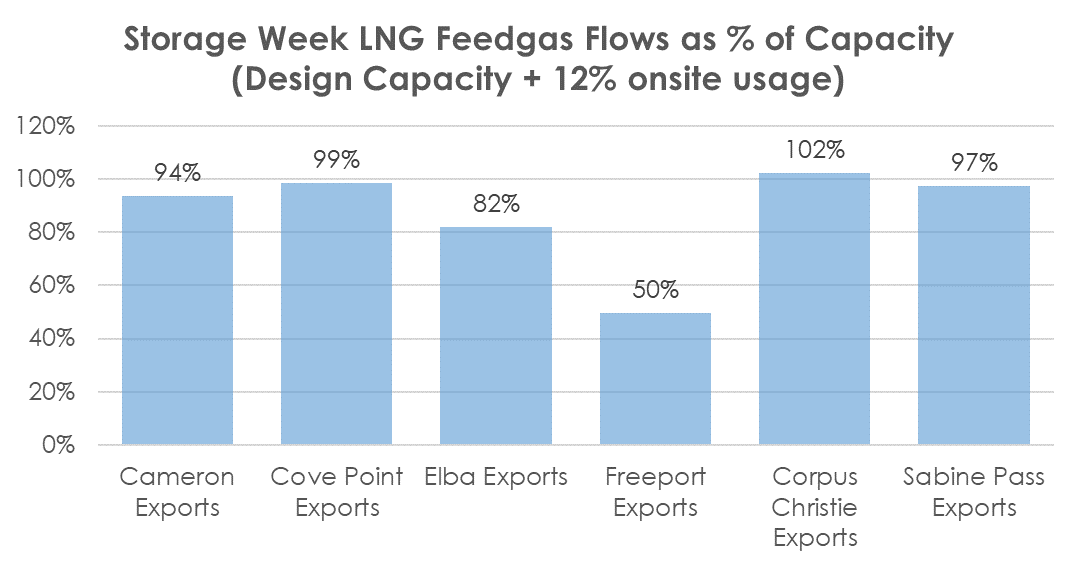
Deliveries to LNG facilities averaged 11.7 Bcf/d, which was -1.3 Bcf/d lower than the previous week. Freeport was the only reason for this drop. The facility has been experiencing lower deliveries (0 on Feb 23rd) since a power outage on Feb 20th. This is the only LNG facility that uses the electric grid to run operations, rather than onsite natgas generators. All three trains were offline, but are now up right before the weekend.
Source: Analytix.AI
The net balance was 0.1 Bcf looser week-on-week.
This email, any information contained herein and any files transmitted with it (collectively, the Material) are the sole property of OTC Global Holdings LP and its affiliates (OTCGH); are confidential, may be legally privileged and are intended solely for the use of the individual or entity to whom they are addressed. Unauthorized disclosure, copying or distribution of the Material, is strictly prohibited and the recipient shall not redistribute the Material in any form to a third party. Please notify the sender immediately by email if you have received this email by mistake, delete this email from your system and destroy any hard copies. OTCGH waives no privilege or confidentiality due to any mistaken transmission of this email.