We are coming off the second-largest storage draw on record. The 338 draw was within expectations, and after a wild month of price volatility the market brushed off the draw. Interestingly, salt storage drew 83 Bcf which was the largest draw from this category on record. The previous record was a 78 Bcf draw for the week ending Jan 5, 2018, which was the week we drew 359 across the L48.
According to the US Govt, there are 38 salt storage facilities across the US. There are two in the Midwest, two in the East, and the rest in the South Central region. The total working gas capacity is 488 Bcf, with max deliverability of 36 Bcf/d. We did not get anywhere close to the max deliverability, but the extrinsic value of the salt storage assets is fully recognized when you have a cold event like this, i.e. a major cold event in the back end of winter.
[The natural gas storage facilities file is attached]
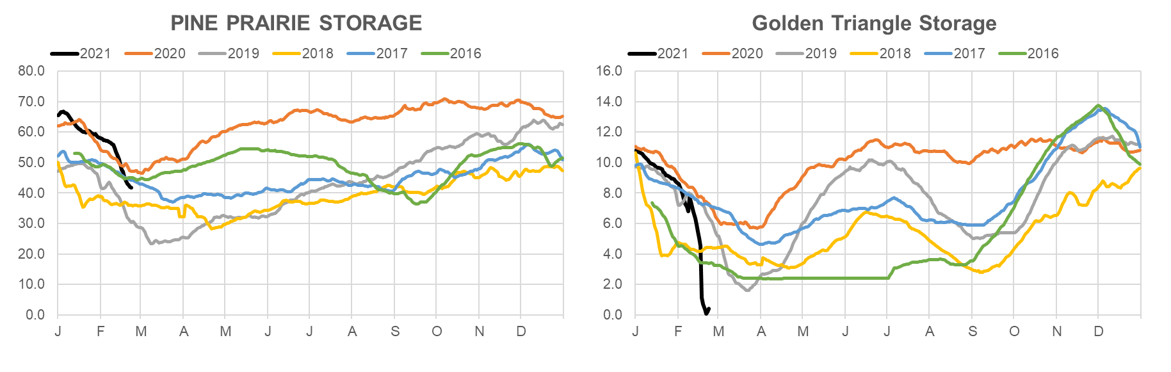
We have daily visibility to two salt storage facilities through the pipeline scrapes – Pine Prairie and Golden Triangle. As can be seen, both exercised their high deliverability (especially Golden Triangle).
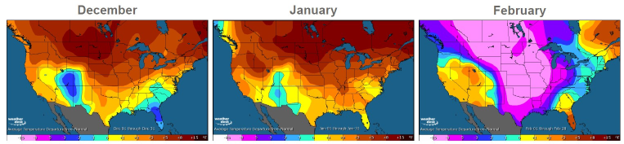
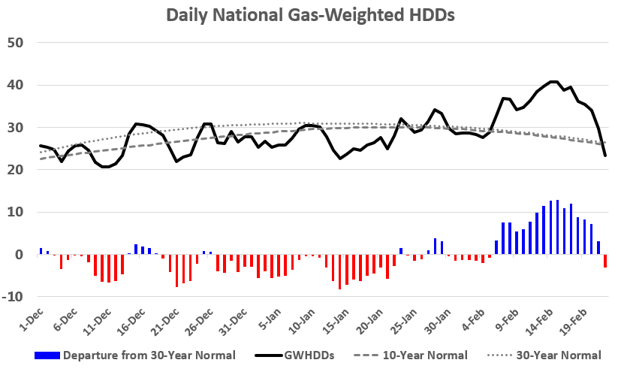
For the rest of the report, we will focus on forward-looking weather after having generally a warm winter, except for the Feb episode. This chart and map from Maxar shows how this winter has trended. Taking out the Feb 10-20 extreme weather event, and this would have been one of the warmest winters on record.
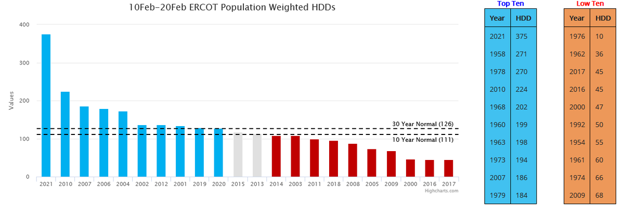
The graphic below shows just how the Feb 10-20 window was by far the coldest on record for mid-Feb. 2010 was the only other recent year that was comparable, but even that comparison is a stretch.
Let’s look forward to March and beyond.
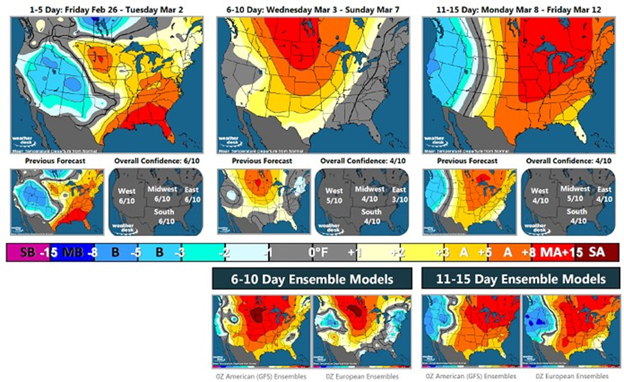
Weather looks to be making one last bearish move to end winter. While March is not as key, it still does matter if it is strong to one side or the other. This is especially true this winter with end-of-season storage projections showing a significant deficit to recent years. In terms of GWHDDs, we see well below normal demand on the way over the next 15 days, more so in the GEFS Ensemble than the Euro Ensemble.
According to The Weather Company, the March-April-May could trend increasingly warmer than average across a large part of the United States. The La Nina state looks likely to persist, and the hotter climate regime is hard to bet against for early summer.
Temperatures in March are predicted to be above average from the Southwest and Southern Plains eastward to the Ohio Valley and Northeast. Most other areas could see an overall temperature trend for the month that winds up right around what is typical for this time of year.
There is some risk to this forecast. It has the potential to trend colder in later updates, especially in parts of the central and western states. Historically cool February’s have led to cool conditions in March.
Even if the cooler temps do realize, the consensus is that April and May are warm to hot for much of the country.
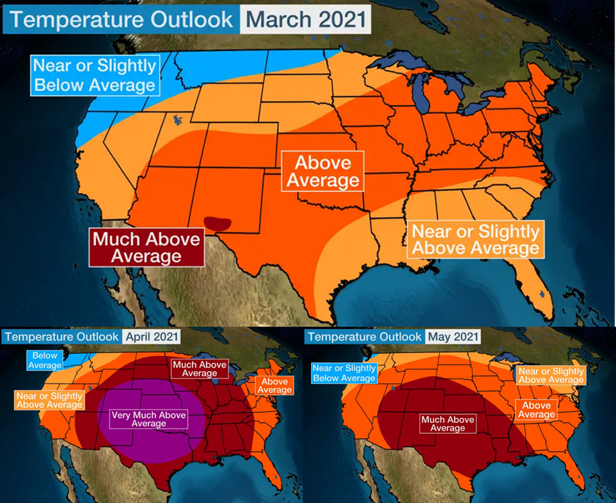
Source: The Weather Network, IBM
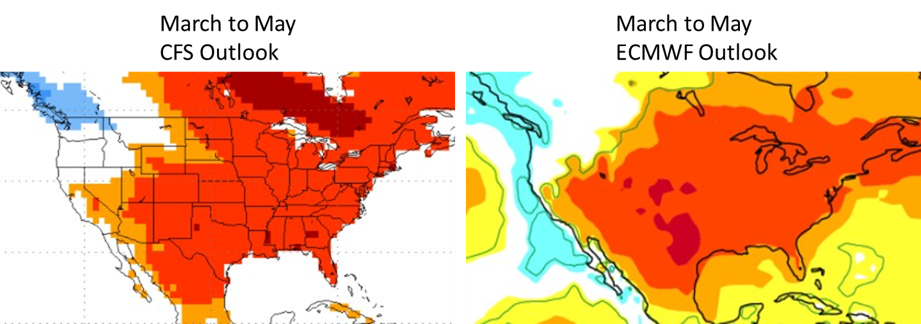
Below are the simulations for the same period for the CFS Outlook, and the ECMWF Outlook. Both show a very consistent outlook for the spring that could lead to some early cooling degree days (and tighter balances).
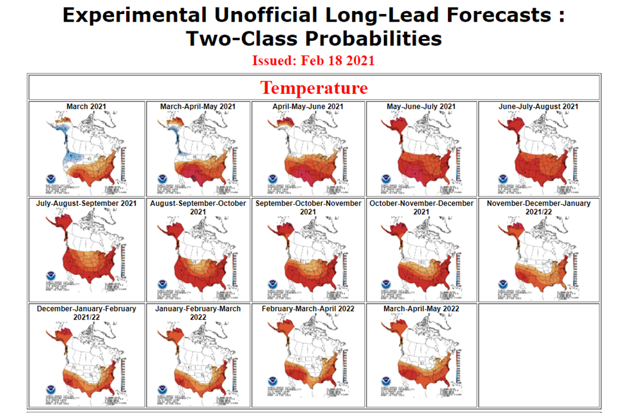
Lastly I wanted to point the readers to the longer term outlook posted by the Climate Prediction Center. The view for Mar-Apr-May is similar to the above, and the months beyond that show red across the board.
Bookmark this link
Climate Prediction Center – Official Long-Lead Forecasts (noaa.gov)
Fundamentals for the week ending Feb 26: As we noted above, the report from this past Thursday was the 2nd highest pull in a storage week. We now sit at a -298 Bcf to last year. This week we are not expecting anything close to that.
Our early view for the upcoming storage report is a -150 Bcf withdrawal for the lower 48. This would take storage levels to 1793 Bcf (-329 YoY, -230 vs 5Yr). The industry estimates for this report range between -181 to -117 according to The Desk.
For week ending Feb 26, supply came back strong and to “normal” levels by the end of week. L48 production rose from 79.4 Bcf/d to 92.5 Bcf/d by the end of the week. On average L48 production rose by 8.4 Bcf/d from the previous week. Production is back to normal in all regions, and in the Gulf we are actually seeing production greater than the levels going into this cold episode. Its difficult to say if this is correct since the sample data from Texas not great, but it is possible to have higher production temporarily if the freeze-off events led to building pressures at the wellheads that is now being released.
We recorded L48 GWHDD decreasing by an average of -9.6 to 23.9. With the warmer termps, total gas consumption decreased accordingly by an average of 23.4 Bcf/d to 100.2 Bcf/d. These are the demand levels we last saw during week ending Jan 22nd. For this past week, power was lower by 4.9 Bcf/d. RC and Industrial were both the notably lower as well. RC was lower by 18 Bcf/d WoW, while Industrial was lower flat.
Deliveries to LNG facilities averaged 7.8 Bcf/d, which was +2.9 Bcf/d higher than the previous week. LNG operators have not brought back their full capacity. Freeport has been slow to ramp up, while Sabine did get back to normal before pulling back at the end of the week.
Net the balance was looser by 26.4 Bcf/d week-on-week. A wild shift.
Expiration and rolls: UNG ETF roll starts on Mar 15th and ends on Mar 18th.
Apr futures expire on Mar 29th, and Mar options expire on Mar 26th.
This email, any information contained herein and any files transmitted with it (collectively, the Material) are the sole property of OTC Global Holdings LP and its affiliates (OTCGH); are confidential, may be legally privileged and are intended solely for the use of the individual or entity to whom they are addressed. Unauthorized disclosure, copying or distribution of the Material, is strictly prohibited and the recipient shall not redistribute the Material in any form to a third party. Please notify the sender immediately by email if you have received this email by mistake, delete this email from your system and destroy any hard copies. OTCGH waives no privilege or confidentiality due to any mistaken transmission of this email.