This week we take a look at the output of the EIA’s monthly Drilling Productivity Report (DRP). Most shale plays are expected to have an increase in natural gas production in February. The Marcellus/Utica (Appalachia) is expected to, will see an increase of 81 MMcf/d in production next month. The Haynesville continues to see explosive growth, with an increase of 127 MMcf/d next month. The Permian will see a huge increase in natgas production of 122 MMcf/d due to more rigs being deployed in the region. The Permian’s oil production is set to hit a new all-time high in February, forecasted to hit an average of 5.076 million barrels of oil per day.
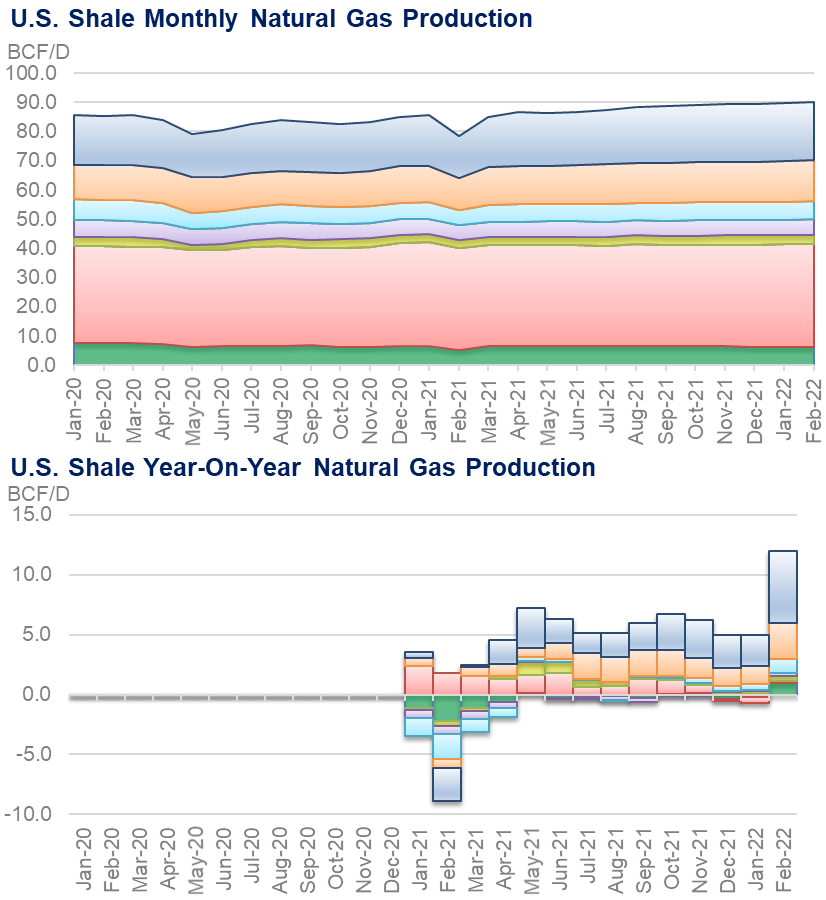
The big year-on-year increase for February is a bit misleading as we had massive freeze-offs last year with Winter Storm Uri knocking out a considerable amount of West Texas and Midcon production. We should clarify that the Feb projection is at the wellhead level (wet-gas) and that there are no adjustments made for freeze-offs.
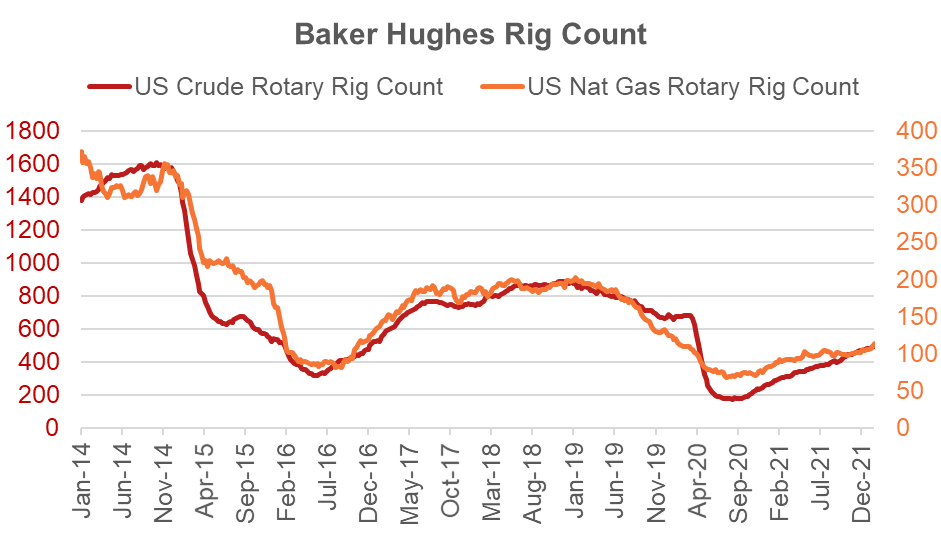
The DPR continues to show growth in production despite still depressed rig count levels. In the past year, we have seen oil rigs come back, but gas-only rigs have been slow to resume. There are currently 113 gas rigs active, which is a 28% increase over last year. Over the same time frame, oil rigs have grown by 202 or 70%.
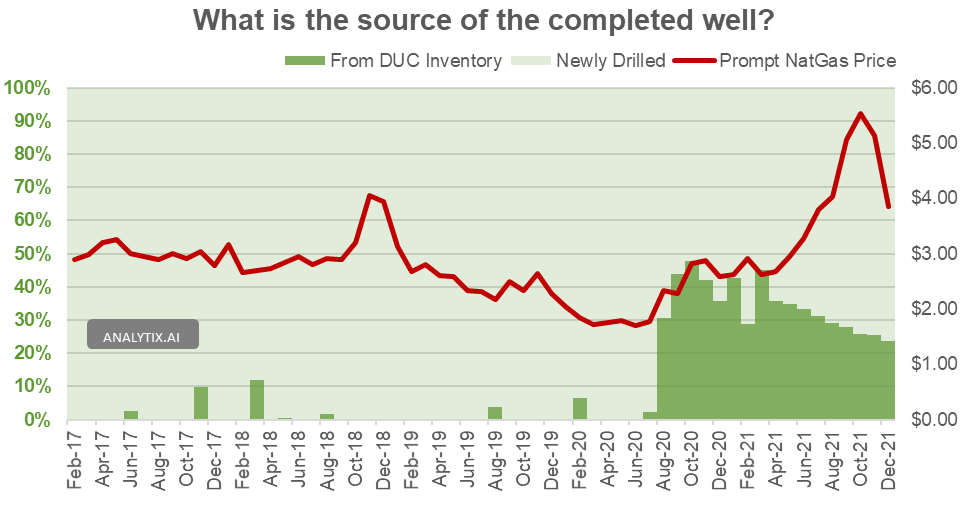
With fewer rigs operational, producers have been relying on the large inventory of DUCs that had been built up before the COVID-19. In 2021, 32% of all wells that were completed came from the existing DUC inventory. In the chart below you can see that starting Aug 2020, oil & gas producers heavily replied on DUCs to keep production from dwindling lower and were able to grow it in 2021.
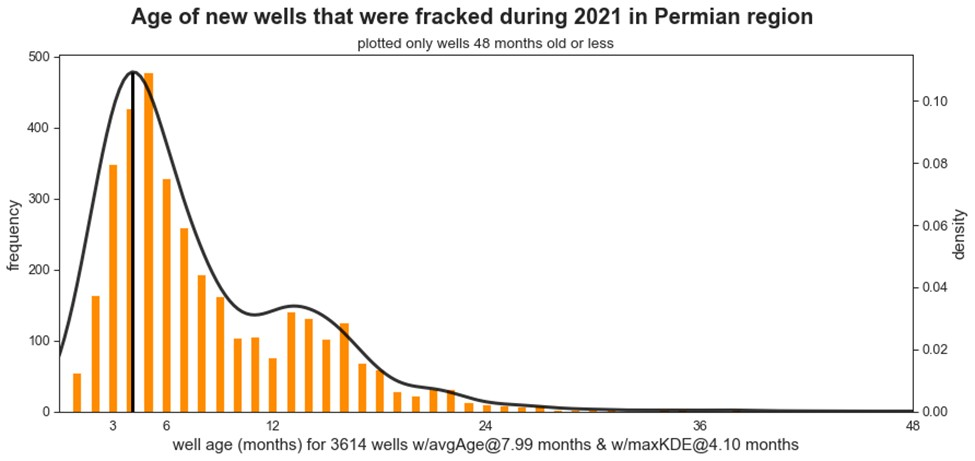
That being said, the DUC inventory is starting to run low. The overall DUCs reported for all DPR regions decreased by 214 wells to 4,616 wells in December 2021. Of the existing wells, the EIA estimates that approximately 2,600 DUC wells are older than two years. These older wells are typically uneconomic or not connected to pipeline/processing networks.
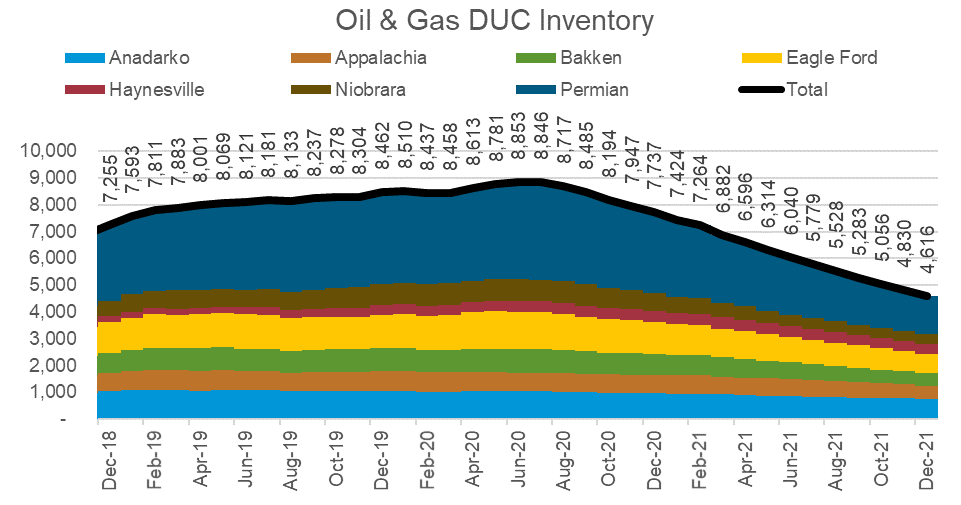
Here is a chart provided by the EIA showing the age of wells fracked during 2021. As seen, very few are over the age of 24 months.
Fundamentals for the week ending Jan 21:
The EIA reported a -206 Bcf withdrawal for the week ending Jan 14th, which was slightly above market consensus.
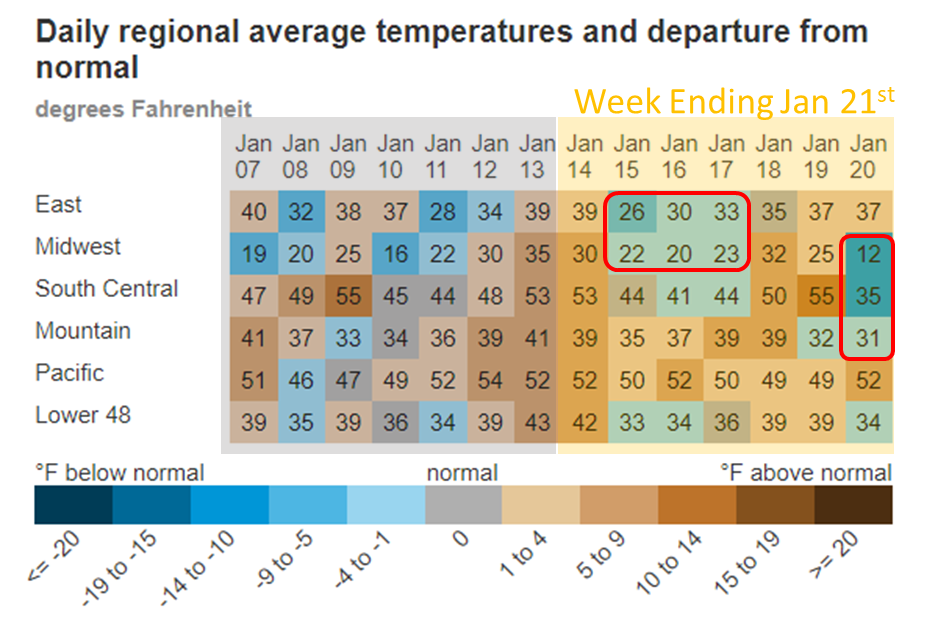
The shift in cooler weather to the Northeast led to a double hit with a loss of Appalachian production due to freeze-offs and rising demand from the rescomm sector. At the national level, total GWHDDs rose by 2.6F.
As we noted last week, the total power load rose by 7% with coal generation helping fill the gap the most amongst all other gen types. The strong performance coal was primarily a result of where the cooler weather hit – the MISO region. The plunging temps over the power market resulted in a growing power load and higher cash prices which is pushing the regional LDCs back to coal.
For the week ending Jan 21st, our early view is -217 Bcf. This reporting period will take L48 storage level to 2,593 Bcf (-210 vs LY, -44 vs. 5Yr).
With this week’s report, we are expecting another 3 200+ Bcf weekly draws. This has only happened once in the past. A tweet from Celsius Energy showed other years we saw consecutive 200+ weekly draws. With the weekend’s weather change cooler, we now have week ending Feb 4th higher than 200. If we do get the 4 in a row, this will tie us with 2014.
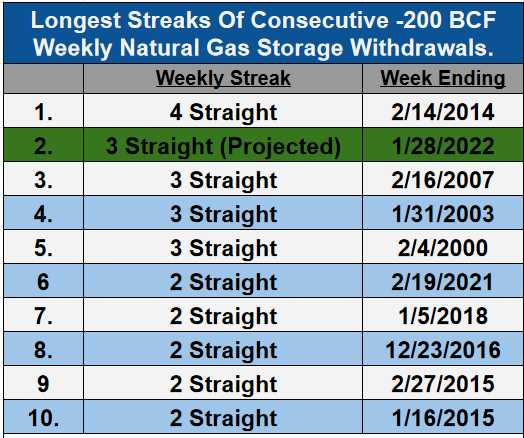
(note: that is Celsius projection from Thursday AM. As of Saturday, we are projecting 4 Straight)
Now to this past week. Total consumption once again did rise with temps similar to the week prior. The cooler weather remained over the Midwest and Northeast leading to total gas consumption peaking around 120 Bcf on a few days. To put this level into perspective – these are levels we saw during Winter Storm Uri last year.
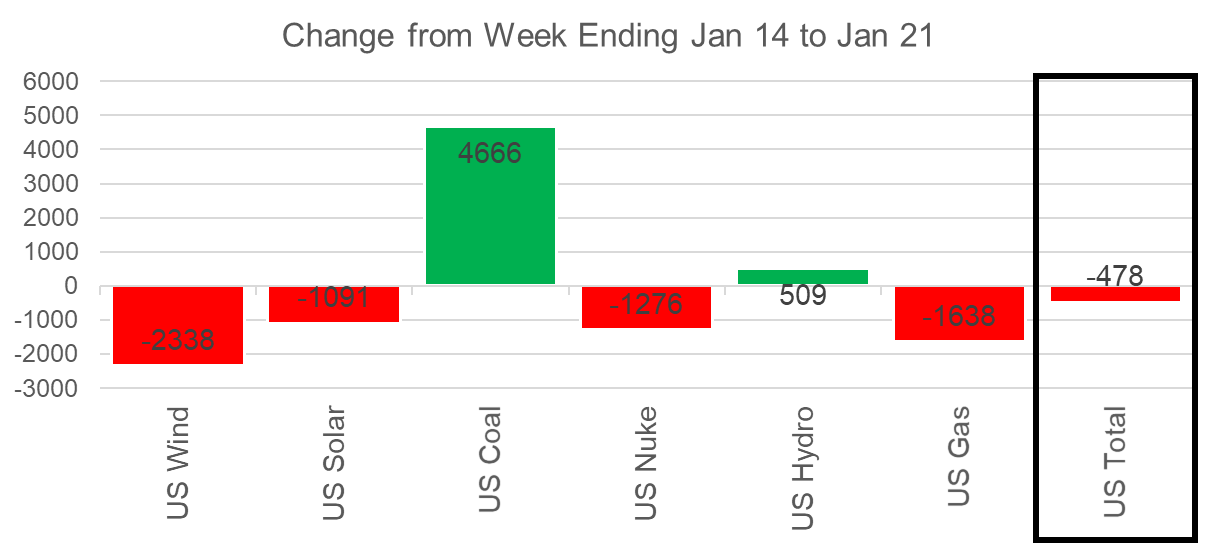
The overall power mix was quite consistent week-on-week. We did see coal rise slightly and other gen types gave up some ground. Here is the L48 weekly generation change.
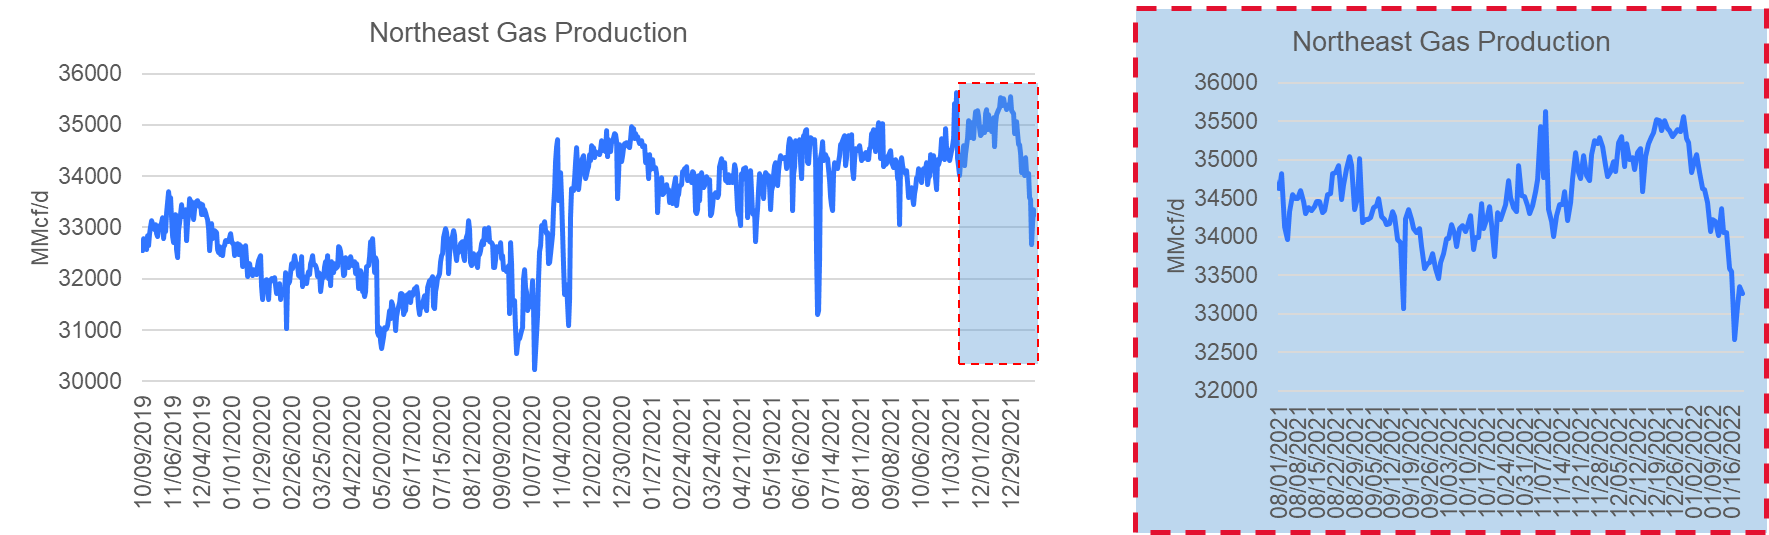
Domestic dry gas production continues to trend lower than levels we saw before the holidays (~96.5 Bcf/d). The cooler temps and heavy snow continued to put pressure on Appalachian production which came in approximately 0.7 Bcf/d lower week-on-week.
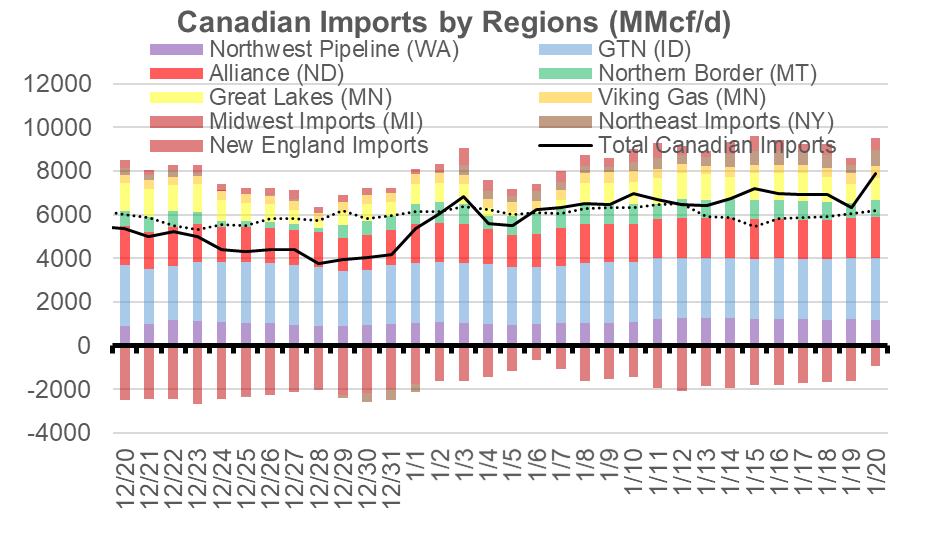
Canadian imports once again rose to moderate overall US supply. Net Canadian supply rose by 0.4 Bcf/d. Over the last few weeks we have seen more flow coming from Westen Canada, and less being exported to Ontario from the Midwest. On Jan 20th, net receipts from Canada reached 8.0 Bcf/d which are levels we saw during Winter Storm Uri.
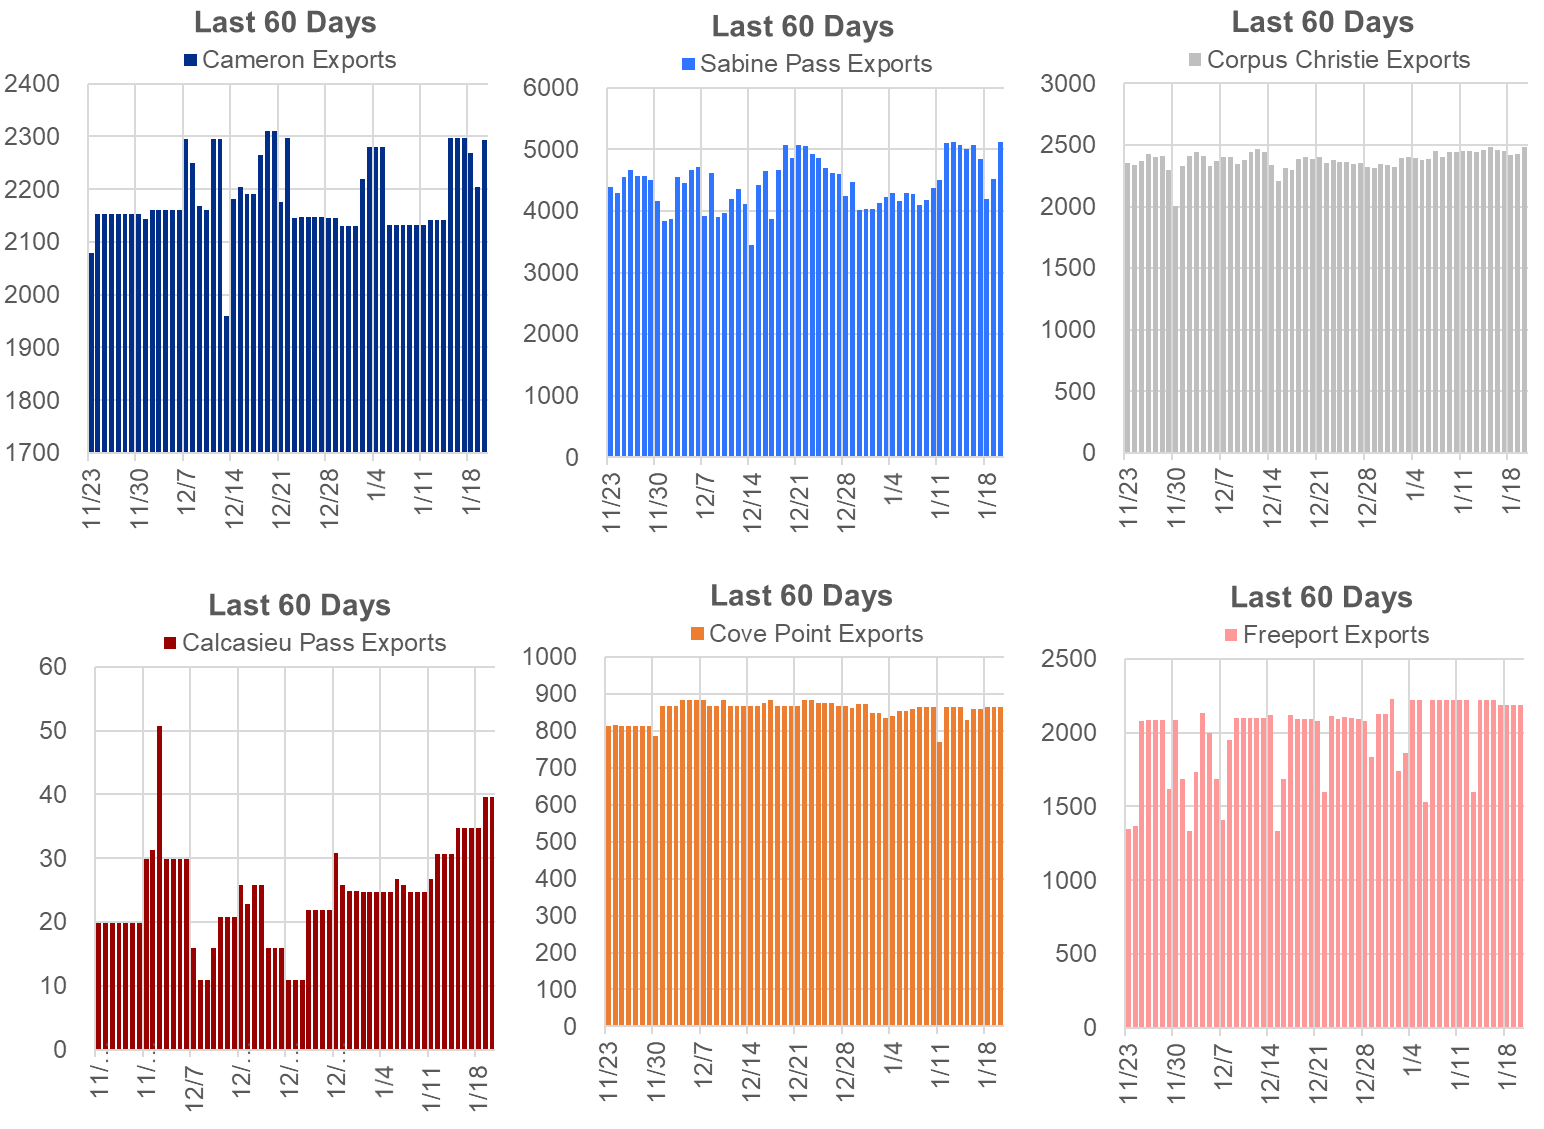
Deliveries to LNG facilities averaged 12.9 Bcf/d, which was +0.6 Bcf/d higher than last week. Sabine was the driving factor to the week-on-week increase, with train 6 restarting. The new train is not consistently operating yet, but we are expecting to get there soon. We also see Calcasieu Pass starting to take more gas over the last week.
Here is the terminal-by-terminal view to see how each has operated over the past 60 days.
The net balance was 1.3 Bcf tighter week-on-week.
This email, any information contained herein and any files transmitted with it (collectively, the Material) are the sole property of OTC Global Holdings LP and its affiliates (OTCGH); are confidential, may be legally privileged and are intended solely for the use of the individual or entity to whom they are addressed. Unauthorized disclosure, copying or distribution of the Material, is strictly prohibited and the recipient shall not redistribute the Material in any form to a third party. Please notify the sender immediately by email if you have received this email by mistake, delete this email from your system and destroy any hard copies. OTCGH waives no privilege or confidentiality due to any mistaken transmission of this email.