This week we drop some slides in from a recent presentation from Enervus titled “THE HANGOVER – From ’20 to ’21”. The report goes through the current trends in oil and gas price and production. This is the Q1 2021 installment of the Enverus FundamentalEdge Series.
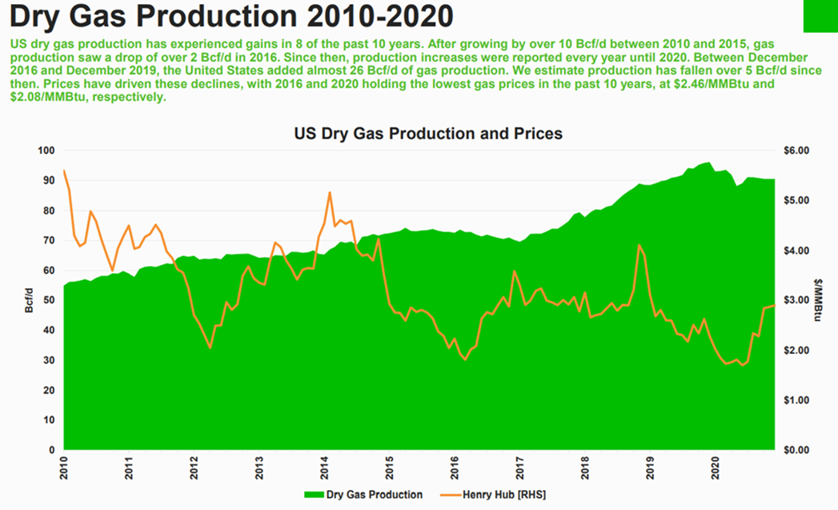
Natural gas operators responded quickly to stronger prices during the fourth quarter of 2020, increasing gas production by 1.7 Bcf/d in November alone. However, winter demand started weak, and prices quickly lost ground. On the demand side, LNG exports are back up from the lows observed in July as economics (Europe versus US price spread) continue to improve. Enverus expects gas prices to average $3.25/MMBtu, levels higher than those currently observed in the forward curve, particularly in 2021 and 2022, when oil prices are expected to remain depressed at $45-$50/Bbl .
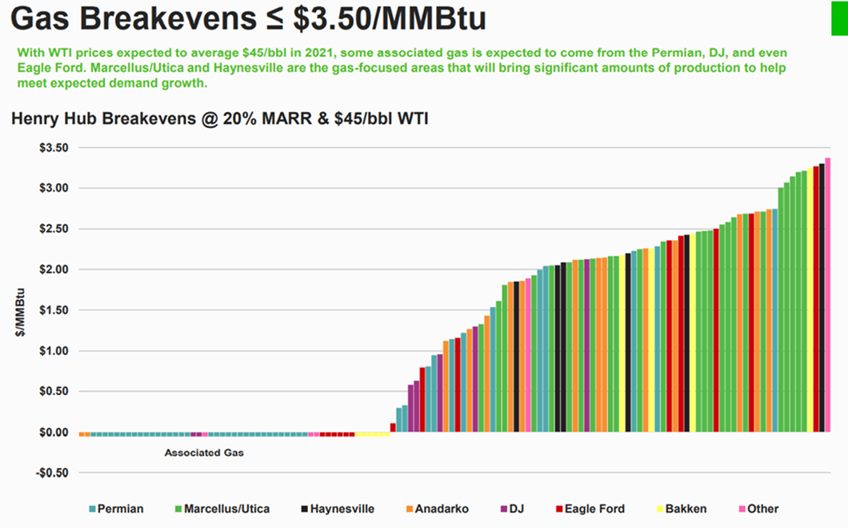
The following shows gas break-evens at $45/bbl WTI and 20% rate of return. The prompt month WTI contract trades at $52-52.50/bb, with the structure being backwardated. The 24month average is 49.5/bbl; hence with current higher price the natgas breakevens from the oily and rich gas plays are lower than represented in the chart. Interestingly, the Northeast dry gas plays show up amongst the most expensive in this chart.
This data comes out of the Enverus Prodcast product.
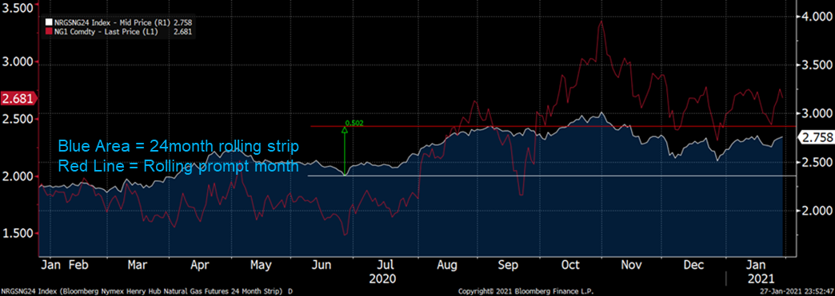
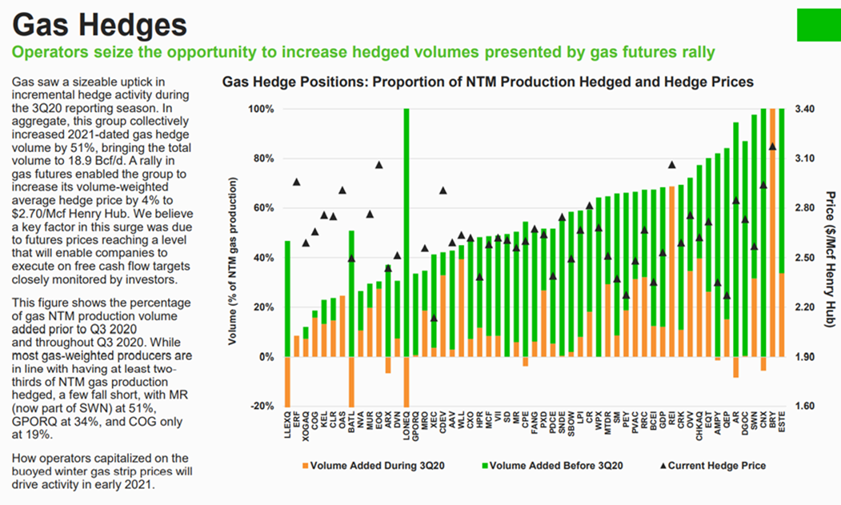
As can be seen in the chart below, total gas hedges grow in Q3. This coincided with gas prices moving higher in Q3 as fear set in with massive production declines. We looked at the nat gas 24 month strip to see its move during Q3. The stripped moved from a low of 2.39 to a high of $2.89/MMBtu.
Total gas hedges at the end of 3Q20 totaled 18.9 Bcf/d.
The complete report can be downloaded here: https://www.enverus.com/2021-1-upstream-fundamentaledge-report-preview-january-2021/
Fundamentals for the week ending Jan 29: Our early view for the upcoming storage report is a -188 Bcf withdrawal for the lower 48. This would take storage levels to 2693 Bcf (+45 YoY, +202 vs 5Yr). The industry estimates for this report range between -216 to -175 according to The Desk.
For this past week, supply has seemed to stable out. We observed production in the Northeast drop slightly (potential due freeze-offs as temps cooled across many of the wet gas play), but this was offset by an increase in the South Central. Overall production during January looks to have dropped by only 0.3 Bcf/d from December levels to average out at 91.6 Bcf/d. This is approximately 2.5 Bcf/d lower than last January before oil price wars and COVID started impacting production levels. With cooler temps week-on-week across much of the country (excl the South), total gas consumption jumped by an average of 8.6 Bcf/d. Power was higher by 0.8 Bcf/d WoW, and RC was higher by 5.1 Bcf/d WoW. Deliveries to LNG facilities averaged 10.0 Bcf/d, down 0.4 Bcf/d WoW. LNG feedgas flows bounced around through out the week, but the culprit for the lower levels was Sabine which was facing issues with tanker arrival due to thick fog and maintenance on a pipe compressor stations that feeds the terminal. The issues look to be resolved with Sabine taking 4.3 Bcf/d by Friday.
Net the balance were tighter by 7.9 Bcf/d week-on-week.
Expiration and rolls: UNG ETF roll starts on Feb 10th and ends on Feb 16th.
Mar futures expire on Feb 24th, and Feb options expire on Feb 23th.
This email, any information contained herein and any files transmitted with it (collectively, the Material) are the sole property of OTC Global Holdings LP and its affiliates (OTCGH); are confidential, may be legally privileged and are intended solely for the use of the individual or entity to whom they are addressed. Unauthorized disclosure, copying or distribution of the Material, is strictly prohibited and the recipient shall not redistribute the Material in any form to a third party. Please notify the sender immediately by email if you have received this email by mistake, delete this email from your system and destroy any hard copies. OTCGH waives no privilege or confidentiality due to any mistaken transmission of this email.