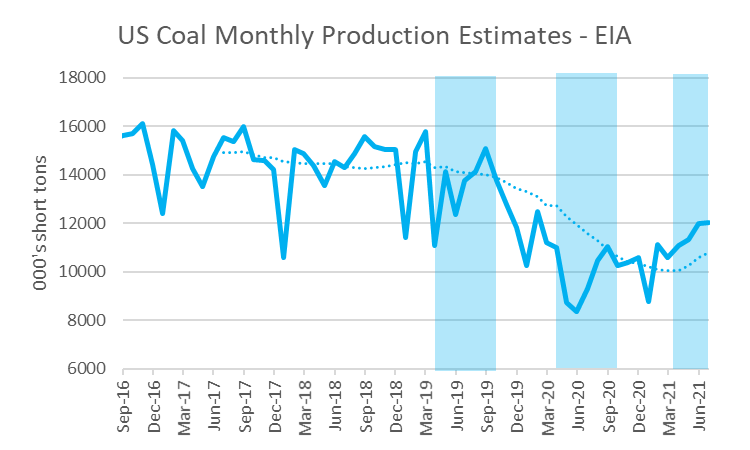
* US coal-fired generation fell 20% in 2020 from the previous year. Natural gas prices started 2020 relatively low because mild winter weather led to less natural gas demand for space heating, and prices remained low as the economic effects of the COVID-19 pandemic reduced both natural gas production and consumption.
* US coal exports were 26% lower in 2020 than the previous year. The COVID-19 pandemic slowed global demand for coal, and some U.S. coal mines were idled for extended periods to slow the spread of the virus among workers.
[EIA]
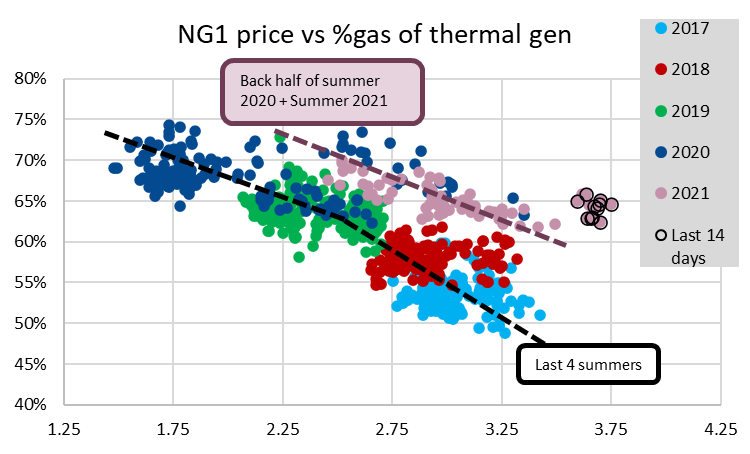
Overall, the drop in coal production and plant retirements looks to have had a structural change in coal-to-gas switching economics. As we showed last week, the back half of last summer and this summer has displayed a C2G relationship that sits on a new access altogether. The lower availability of coal has either pushed out coal from some regional power stacks or pushed up delivered coal prices. As a result, gas kept a strong share of total thermal generation.
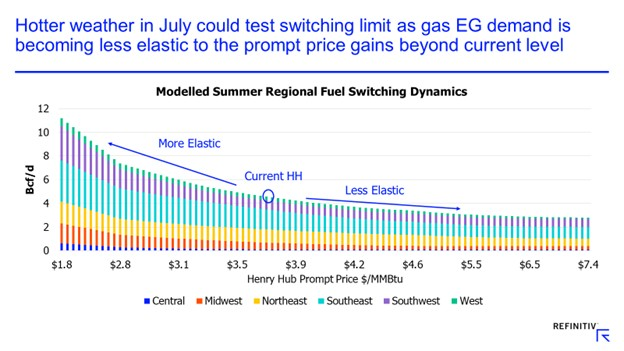
Refinitiv posted a good chart on enelyst this past week. They say that fuel switching gets less elastic as prices move into high gear recently, which will limit gas-for-power demand upside going forward.
Fundamentals for the week ending July 16: This past week the EIA reported a +55 Bcf (actually a +57 Bcf when you add up all the individual storage regions) storage injection for the week ending July 9nd. This report came in 6 Bcf above market consensus and 5 Bcf/d above our estimate. For the past 4 reports, we see one report tighter than expectations and the next loose, and the cycle repeats.
This report once again suggests looser balances relative to the past 5 weeks of storage reports. In fact, and the number was very much aligned with the +67 Bcf injection from week ending June 11th and the +76 Bcf injection from week ending June 25th.
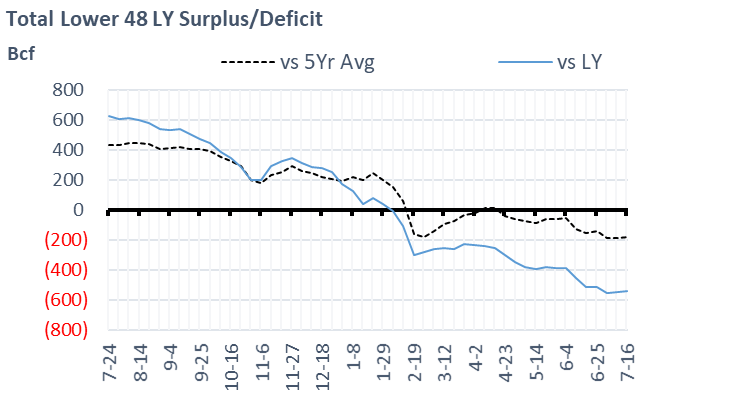
For the week ending July 16th, our early view is +46 Bcf. The 5Yr average is a +36 Bcf injection. Our projected injection would take the L48 storage level to 2675 Bcf (-535 vs LY, -179 vs. 5Yr). As seen in the chart below, the storage levels have gone from a major surplus to a notable deficit but this upcoming report should be larger than the injection from LY and 5Yr average – therefore reducing the overall deficit.
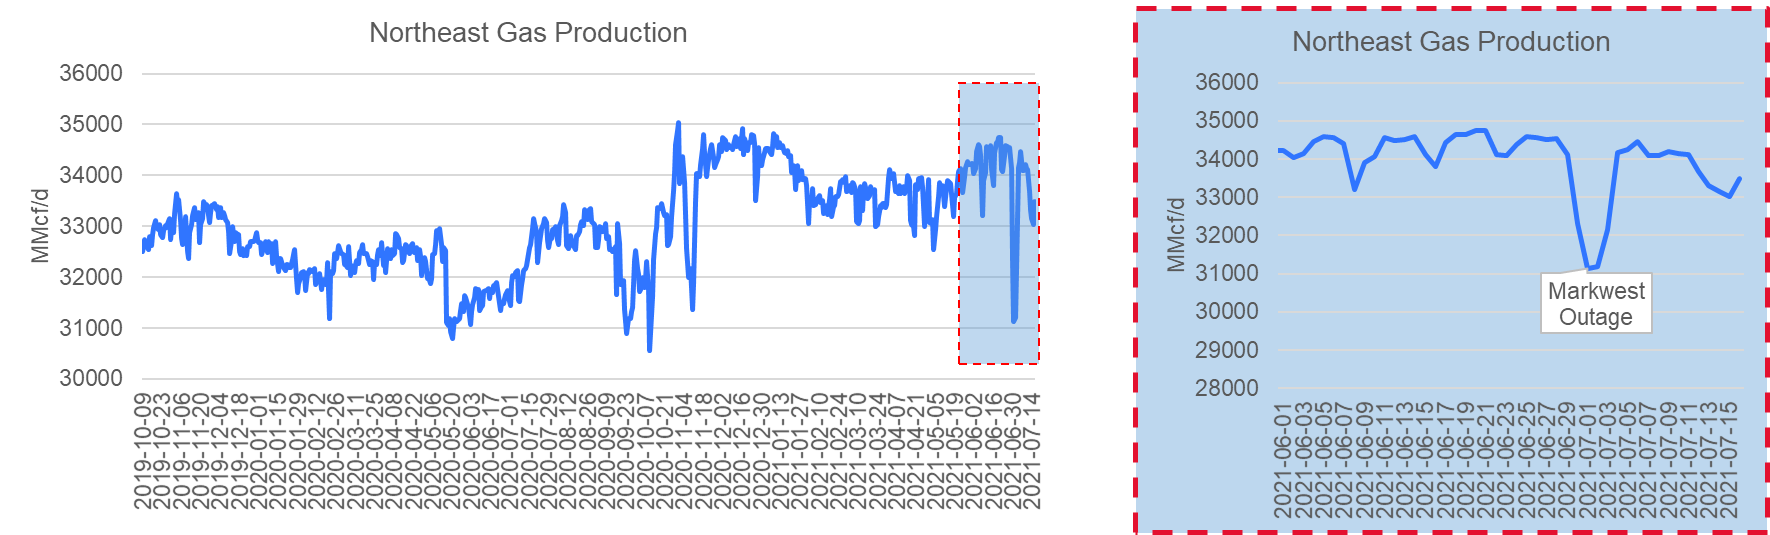
Domestic production was flat to last week. That being said, there have been many maintenance-related and critical events that have lowered Northeast production. For week ending June 2nd, it was lower production related to the Markwest C3+ pipeline leak issue, and this week its lower production from other pipelines – namely Transco, Millennium (from Bluestone Gathering) and REX. US dry production for the week averaged 92.2 Bcf/d which is still within the tight range of 91-93 Bcf/d we have observed since the start of summer.
Total consumption was higher this week driven primarily by power burns, despite it covering the July 4th holiday. Total national temps were warmer week-on-week by 0.8F on average leading to +1.6 Bcf/d additional gas burns. The gas burns would have been even higher, but a return of wind and solar helped. Wind gen alone grew by 30+% to average 20.7 GWh on average. We should also note that coal gen also did pick up to meet the higher load. Industrial demand kept steady despite the holiday. Typically July 4th is a holiday that impacts industrial demand as facilities and plants stay beyond just the single day holiday. We did not see that from the data this year.
Deliveries to LNG facilities averaged 10.8 Bcf/d, which was -0.2 Bcf/d lower than the previous week. Columbia Gulf pipeline had a maintenance event planned for multiple compressor stations upstream of the Cameron last weekend leading to the lower feedgas levels for July 11/12. By late week, LNG feedgas volumes were back to ~11 Bcf/d.
Net the balance is tighter by 0.9 Bcf/d week-on-week.
Expiration and rolls: UNG ETF roll starts on July 14th and ends on July 19th.
August futures expire on July 28th, and August options expire on July 24th.
This email, any information contained herein and any files transmitted with it (collectively, the Material) are the sole property of OTC Global Holdings LP and its affiliates (OTCGH); are confidential, may be legally privileged and are intended solely for the use of the individual or entity to whom they are addressed. Unauthorized disclosure, copying or distribution of the Material, is strictly prohibited and the recipient shall not redistribute the Material in any form to a third party. Please notify the sender immediately by email if you have received this email by mistake, delete this email from your system and destroy any hard copies. OTCGH waives no privilege or confidentiality due to any mistaken transmission of this email.