The EIA reported the March monthly supply and demand data last Friday before the long weekend, which now gives us a complete view of how the winter performed vs prior years. In today’s report, we take a view of how winter looked versus past years. This was a unique year with the L48 being impacted by COVID restrictions (which change normal consumption patterns), lower production due to lower oil prices, and growing LNG capacity.
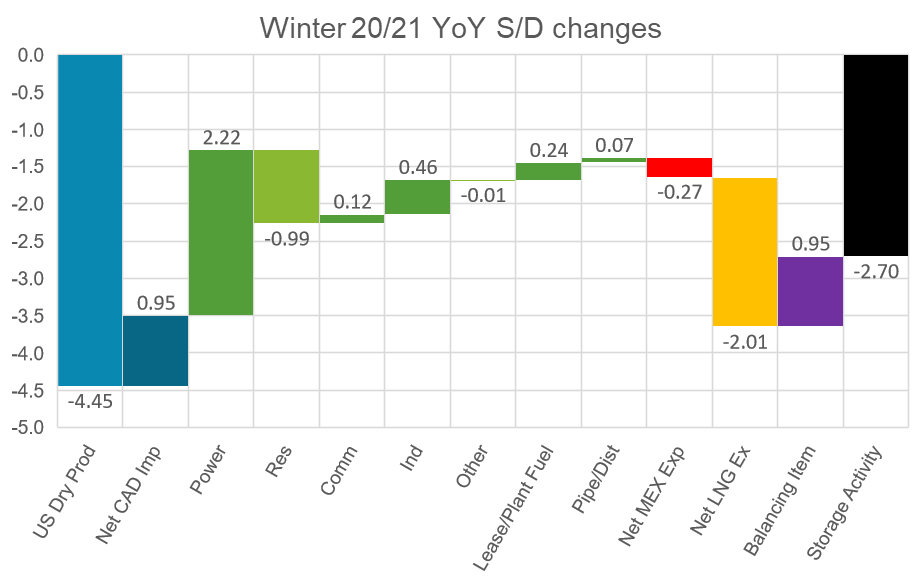
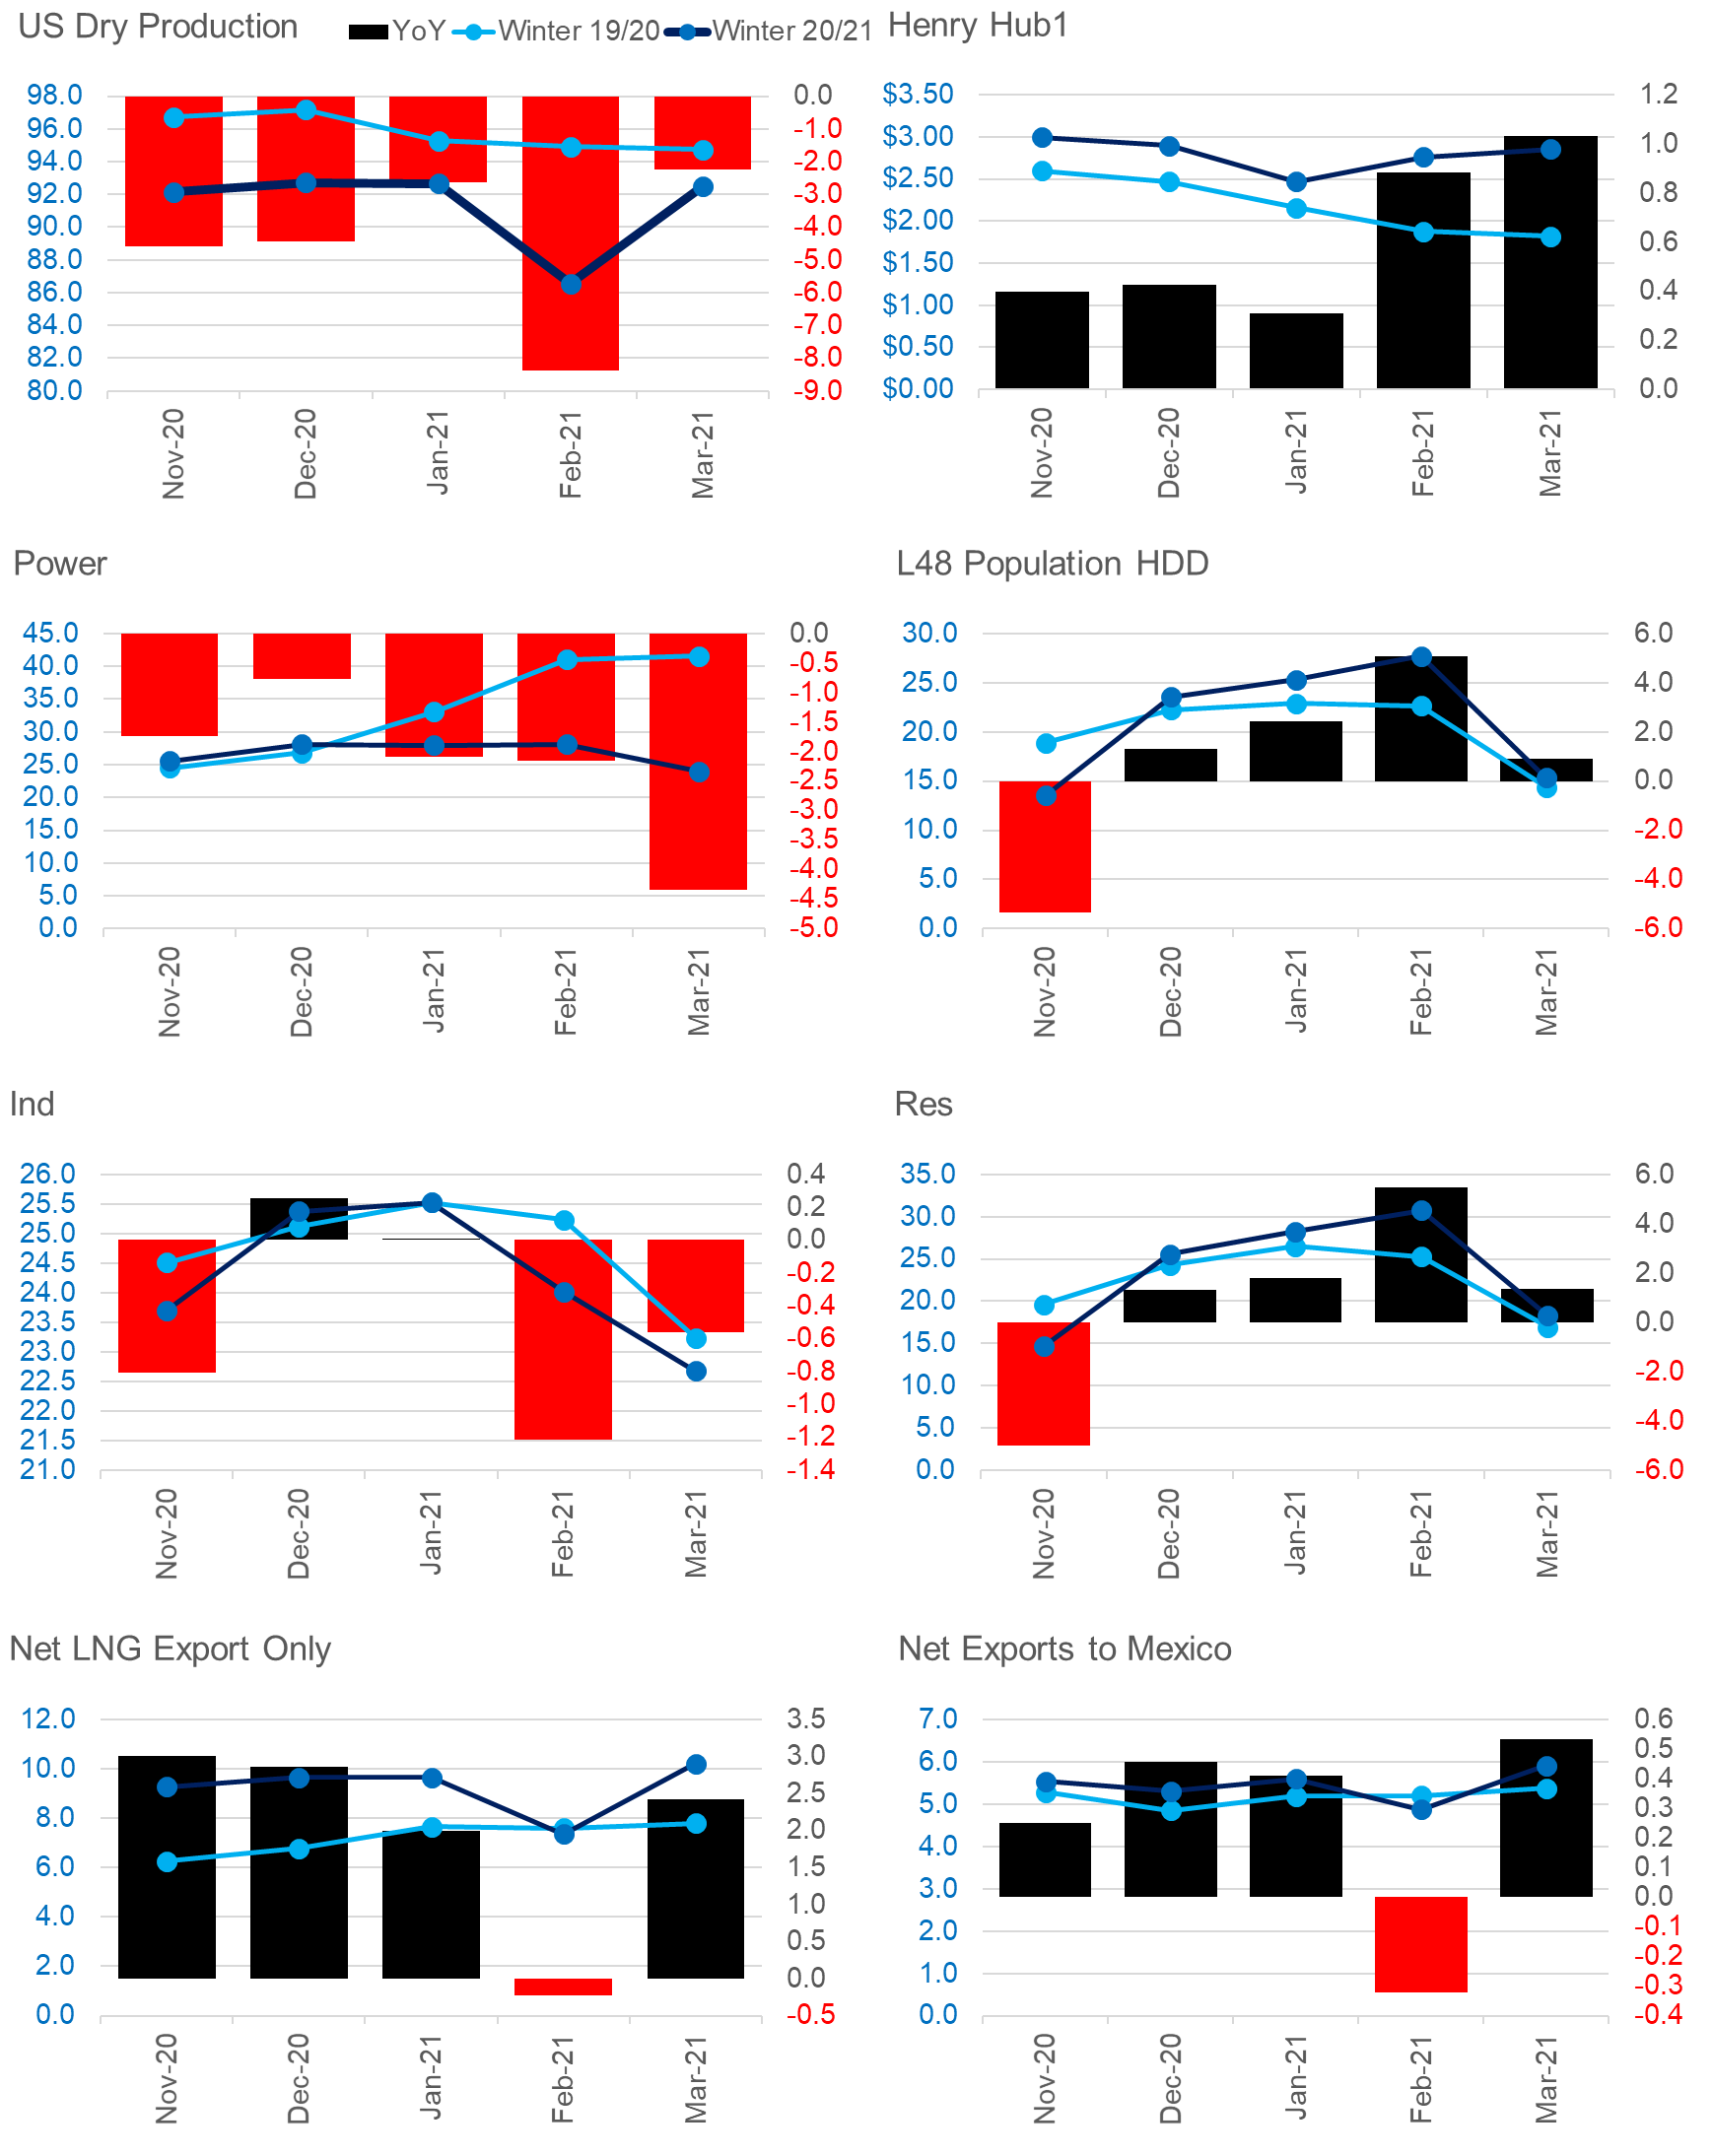
The winter was net tighter by 2.7 Bcf/d winter-on-winter. The two dominant factors leading to the tighter balances were supply and LNG. Domestic production dropped by 4.45 Bcf/d and net LNG exports increased by 2 Bcf/d.
Despite the weather being cooler by an average of 0.9F per day on average this past winter, total consumption was lower mainly due to stronger pricing which reduced the power burns by 2.22 Bcf/d. On average Henry Hub settlements were stronger by $0.61 YoY.
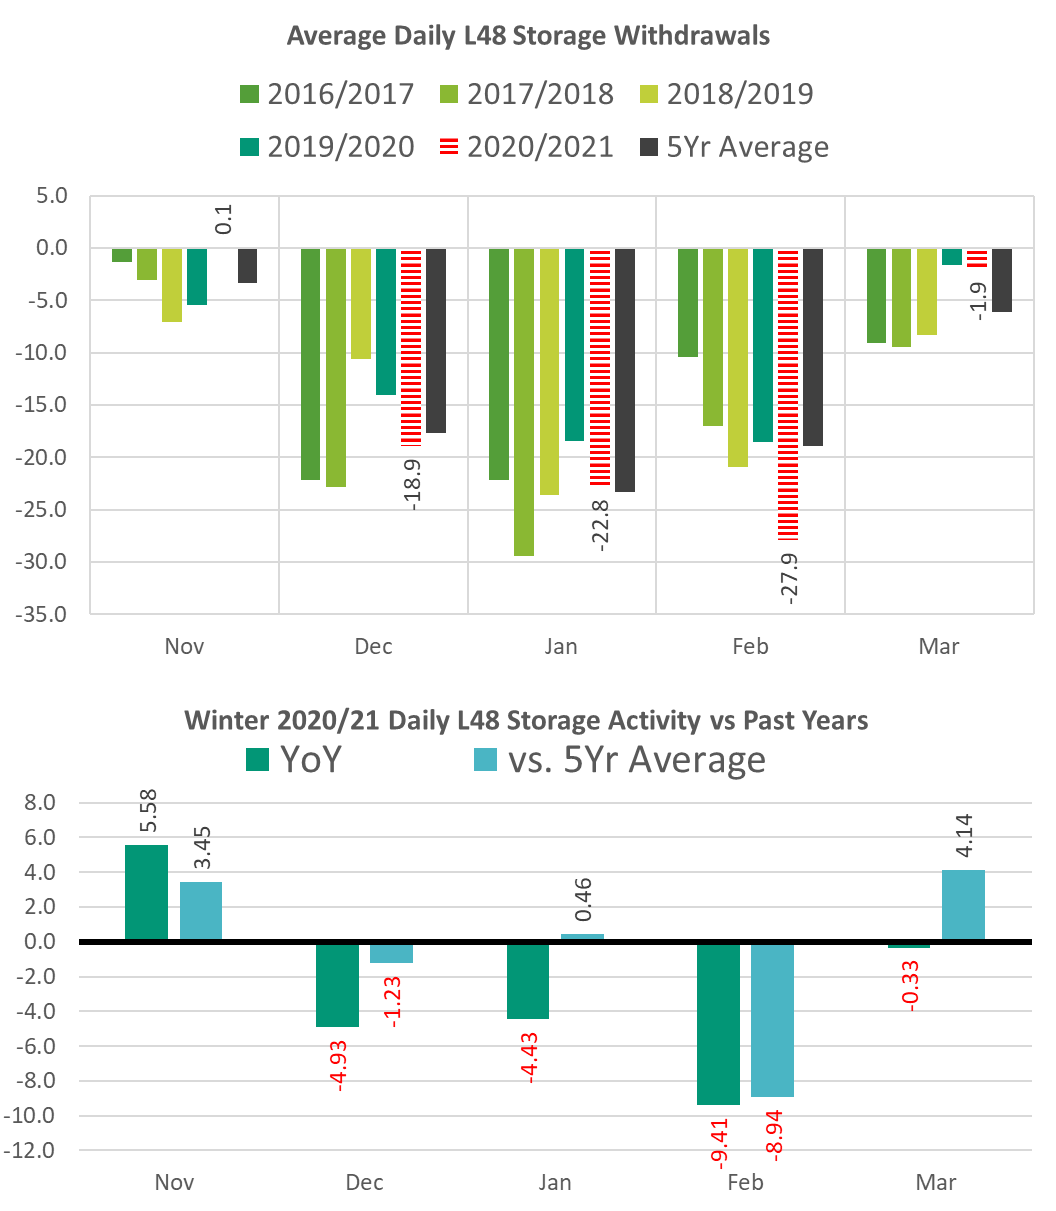
Below shows the storage activity month by month. Dec and Jan were close to the 5Yr average, with only Feb being the major outlier due to the extreme cold. Mar closed out the season flat to last year despite being 1.8F cooler on average.
![]()
This week we’re also including some charts dropped by Xin Tang for Refinitiv on enelyst.com this past Thursday.
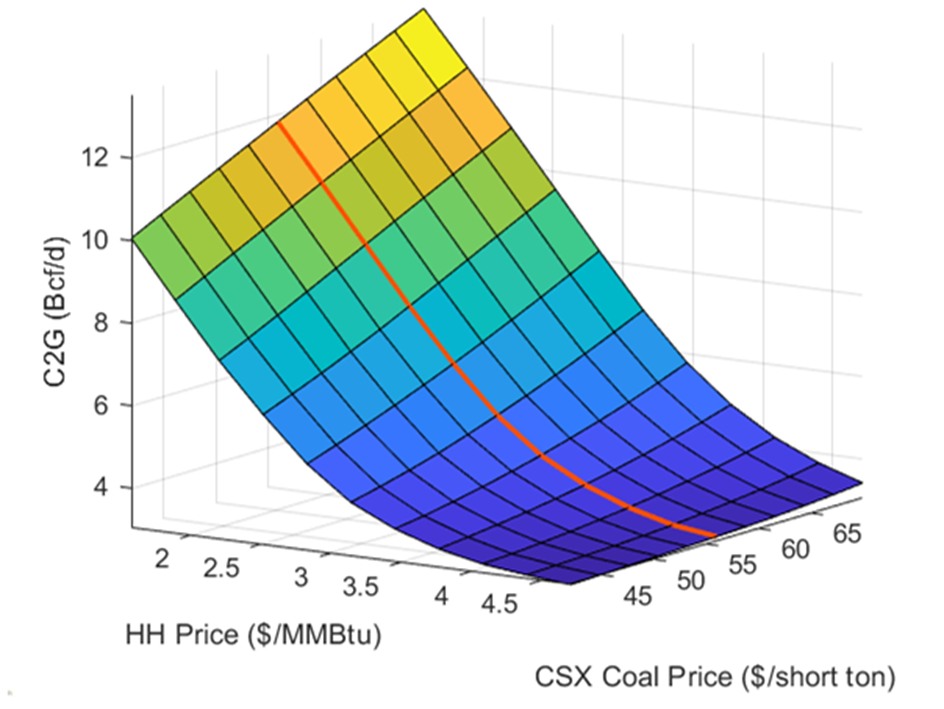
Here is a look at the C2G sensitivity:
Here is a look at the production sensitivity:
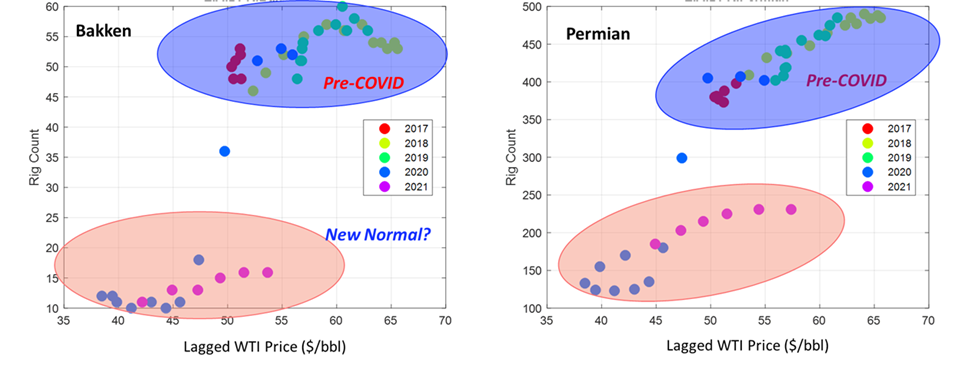
“The production elasticity is becoming a tricky but important part. The producers’ behaviors have significantly shifted after the pandemic began as shown in the rig vs. lagged price plots.”
“E&Ps are hesitant to add rigs even after the oil and gas prices recovered or even surpassed the pre-pandemic level. This will lead to lower price elasticity of the production.”
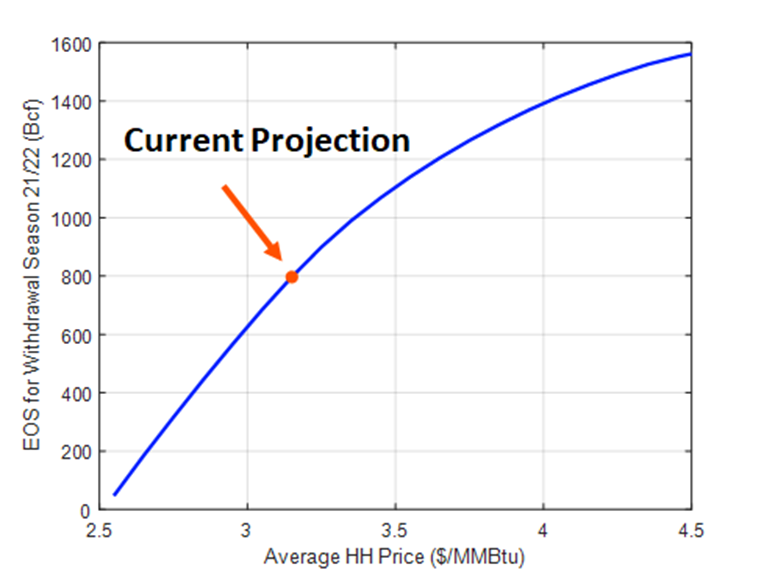
“This convexity is also reflected in price dependent EOS forecast assuming flatline production. Prices may have to go higher from here if there is no production growth”
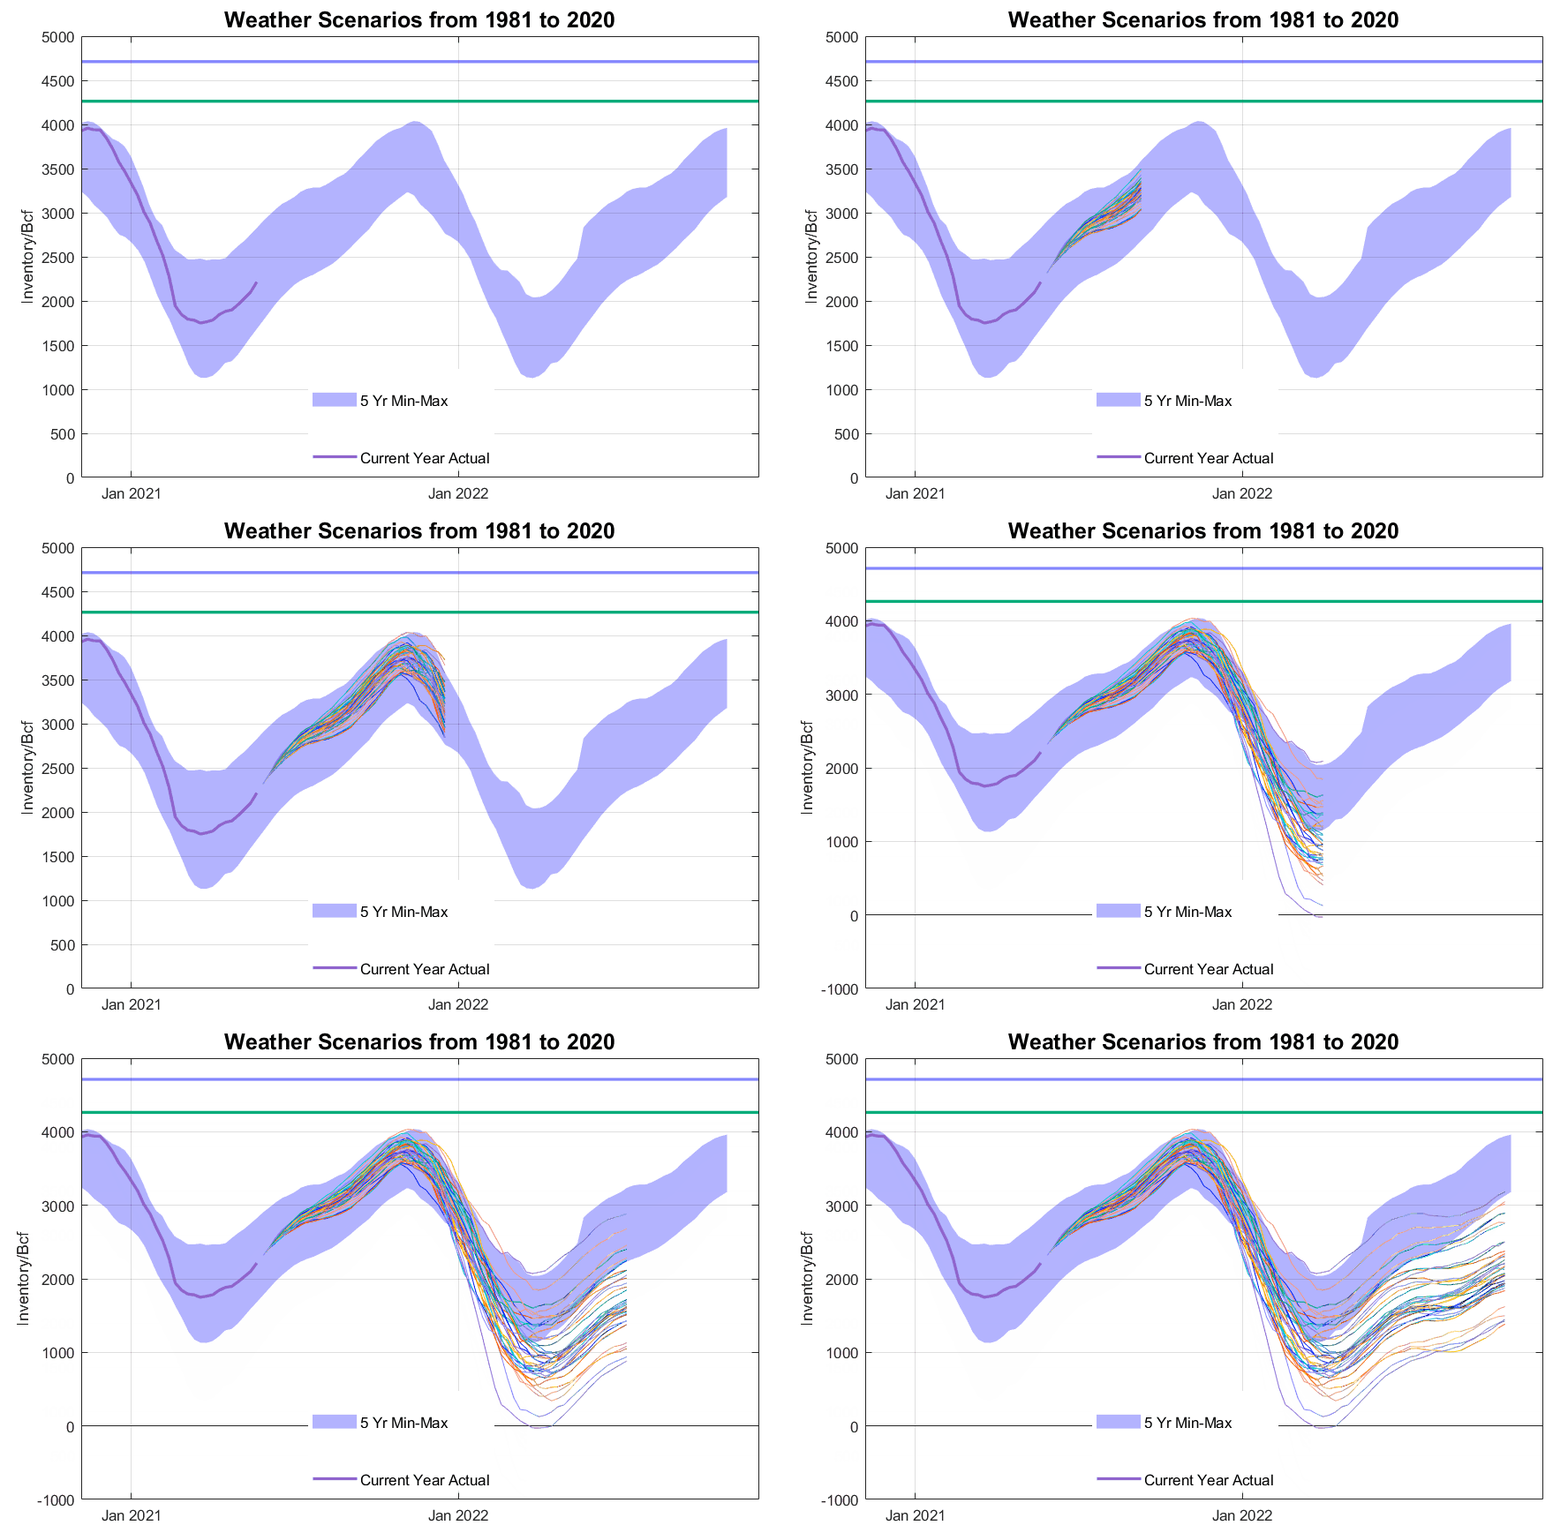
Finally, they showed EOS trajectories on differing weather scenarios.
“I will end this with the weather dependent inventory trajectory assuming no production growth. Again this highlights the risk for the withdrawal season in the absence of production growth.”
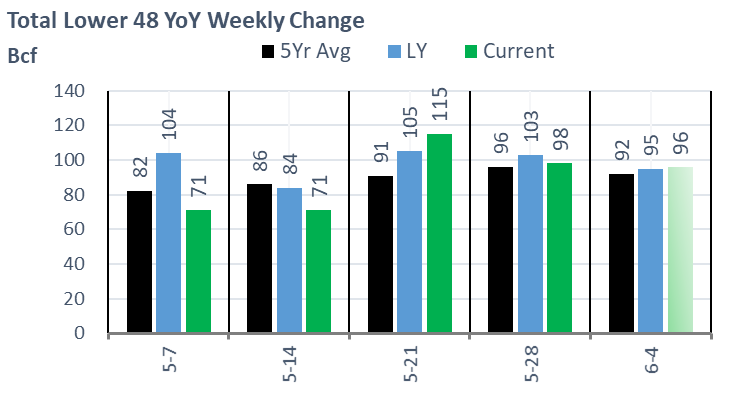
Fundamentals for the week ending June 04: This past week the EIA reported a +98 Bcf storage injection for the week ending May 28. The number came in slightly above market consensus, and close to our estimate of +100. This report once again supports loosening conditions. The summer started with daily balances being 6-7 Bcf/d tighter YoY (wx adj). The consensus is that strong industrial load post-winter storm URI led to tight market dynamics. Those dynamics have quickly shifted to this week’s report being only 0.5 Bcf/d tight YoY (Apr to Aug data only), and now 0.4 Bcf looser than the 3Yr average.
For the week ending June 04th, our early view is +96 Bcf. The 5Yr average is a +95 Bcf injection. Our projected injection would take the L48 storage level to 2409 Bcf (-385 vs LY, -57 vs. 5Yr).
Domestic production slightly lower last week with the TX and the Midcon dropping a little bit of volume. Surprisingly there was not much of an impact to Northeast production with a forced majeure announced by TETCO. The Pipeline Hazardous Material Safety Administration (PHMSA) recently denied TETCO the ability to operate Lines 10, 15, and 25 between the Kosciusko and Uniontown compressor stations at full capacity, noting that effective June 2, capacity at the Danville compressor in Kentucky would be cut from 2 Bcf/d to 1.0-1.3 Bcf/d until further notice. Southbound flows at the Danville station have averaged 1.9 Bcf/d the past 30 days, implying a cut of roughly 0.7-1.0 Bcf/d to pipeline flows leaving the Northeast for the Gulf Coast. With other pipeline corridors leaving the Northeast to the Gulf and Midwest already at capacity, the TETCO outage could result in lower Northeast production, especially on milder demand days when the power sector cannot burn it. So far we have seen little impact to Northeast production. On Friday, TETCO posted a brief update saying the pipeline is still meeting with the PHMSA to discuss the agency’s concerns to return the system to normal operating pressures. At this time there is no estimated timeframe for a potential return to service. On Friday, Columbia Gas also declared a force majeure related to the operating conditions on TETCO.
This week consumption grew slightly with the return of HDDs at the national level. HDDs increased by 2.2F from the previous week, while CDDs moved lower the same amount. With that temperature change, ResComm consumption increased by +2.4 Bcf/d WoW, while power and industrial decreased by 3.6 Bcf/d in total.
Deliveries to LNG facilities averaged 10.5 Bcf/d, which is 0.5 Bcf/d higher than the previous week. The increase comes with Cheniere’s Corpus Christie trending back to normal operating capacity. There is no official announcement on maintenance at the facility.
Net balances are tighter 0.6 Bcf/d week-on-week.
Expiration and rolls: UNG ETF roll starts on June 14th and ends on June 17th.
July futures expire on June 18th, and July options expire on June 25th.
This email, any information contained herein and any files transmitted with it (collectively, the Material) are the sole property of OTC Global Holdings LP and its affiliates (OTCGH); are confidential, may be legally privileged and are intended solely for the use of the individual or entity to whom they are addressed. Unauthorized disclosure, copying or distribution of the Material, is strictly prohibited and the recipient shall not redistribute the Material in any form to a third party. Please notify the sender immediately by email if you have received this email by mistake, delete this email from your system and destroy any hard copies. OTCGH waives no privilege or confidentiality due to any mistaken transmission of this email.
