Last week, the EIA published natural gas consumption data for March. We now have a full view on how this winter stacked up against the previous year and the 10Y normal.
Let us start by reviewing the weather for this past winter. Winter 2019/2020 was warm compared to both last year and the 10Y normal. Not only did most experience the warm temps, but its validated by seeing lots of red in the maps below.
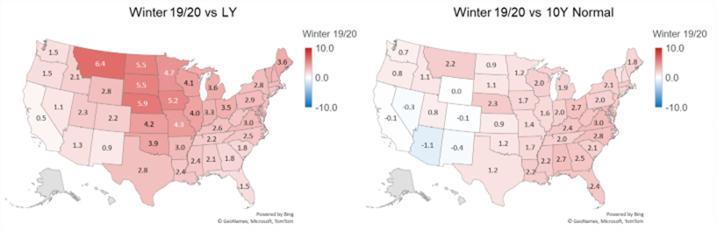
Source: analytix.ai, Bloomberg data
Notably, we had a cold start to winter but ended off with much warmer temperatures along the East coast and Midwest in Jan and Mar. Here is how each month looked this past winter looked vs the 10Y normal.
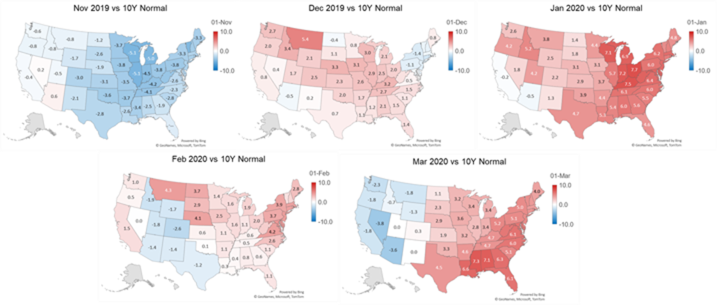
Source: analytix.ai, Bloomberg data
With the EIA data, we gained a clearer view of the different usages of natural gas in North America – specifically power, industrial and ResComm usage.
Since residential and commercial gas usage, are usually the most important for the winter, let’s start there first. The warmer weather led to a lower usage of natural gas for heating across the country, especially in the Midwest and Northeast, which are heavily populated.
For the winter, L48 natural gas usage by the Rescomm sector were 3.97 Bcf/d lower than the previous year. Over the winter, that equated to 599 Bcf of less gas demand relative to the previous year. This makes sense based on the weather map above show we were a lot warmer this past winter vs winter 18/19.
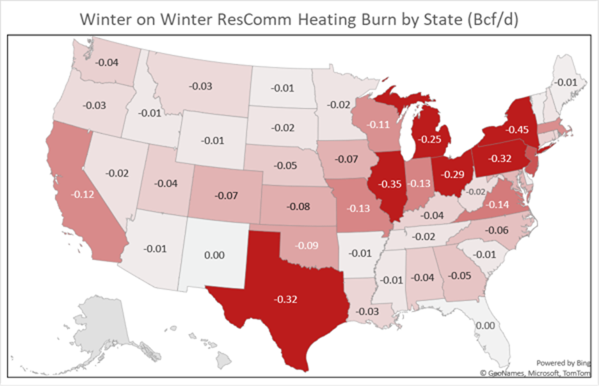
Source: analytix.ai, Bloomberg data
Next, we review power burns. The lack of demand and booming production resulted in extreme loose daily balances pushing prices to extreme lows. The lower prices (and to some degree warmer temperatures) led to high levels of power generation across the country, especially in the South Central and Southeast.
For the winter, L48 natural gas power burns were 2.88 Bcf/d higher than the previous year. Over the winter, that equated to 435 Bcf of more gas demand relative to the previous year. We see this as evidence of the system working, where prices helped keep the system balanced.
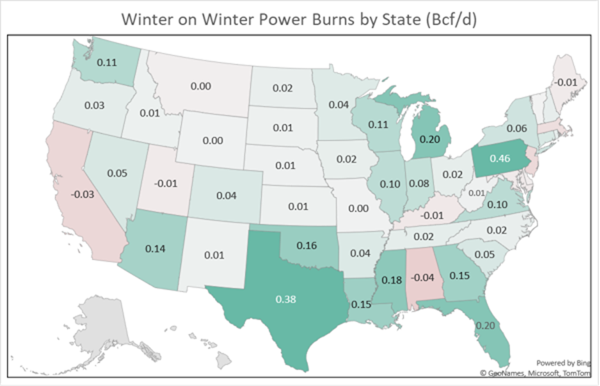
Source: analytix.ai, Bloomberg data
Lastly, we review industrial burns. This is usually uneventful as industrial usage is base loaded. There is small variability related to weather changes, which can be seen in the map below.
For the winter, industrial usage was 0.3 Bcf/d lower than the previous year. Over the winter, that equated to 44 Bcf of lower gas demand relative to the previous year.
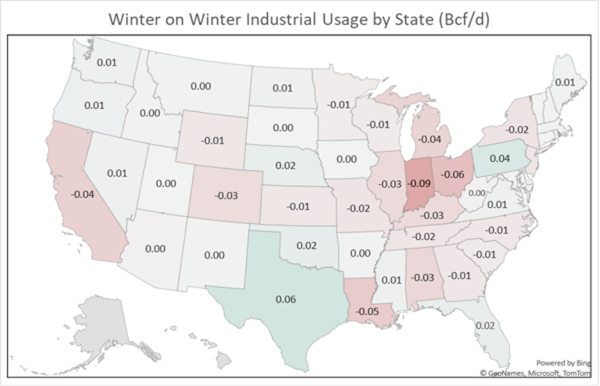
Source: analytix.ai, Bloomberg data
Next month’s data release for April 2020 should be very interesting. We’ll be able to clearly see the impacts of the COVID-19 lock downs state by state.
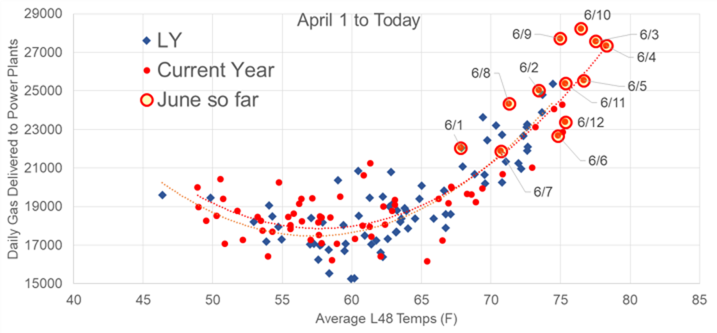
Finally, lets look at how power burns are tracking in June so far vs past months. Burns are outpacing last year with prices hovering below 1.80, and the economy starting to reopen. From the chart below it looks like burns are about 0 to 0.5 Bcf/d higher than last year so far.
Fundamentals for week ending June 13: Our early view for the upcoming storage report is a +90 Bcf injection for the lower 48. This would take storage levels to 2897 Bcf
US natural gas dry production is higher week-on-week with domestic production averaging 84.3 Bcf/d for the week. Average weekly production is 0.5 Bcf/d lower than 4 weeks ago.
Natural gas demand moved higher last week as weather patterns continued to turn warmer. Residential and commercial sector consumption decreased by 0.4 Bcf/d, but power consumption rose by 1.7 Bcf/d.
Canadian imports were lower last week averaging 3.8 Bcf/d.
Mexican exports stayed flat to average 5.6 Bcf/d.
Deliveries to LNG facilities decreased week-on-week to 3.9 Bcf/d.
Expiration and rolls: UNG ETF roll starts on June 12th and ends on June 17th.
July futures expire on June 26th, and July options expire on June 25th
This email, any information contained herein and any files transmitted with it (collectively, the Material) are the sole property of OTC Global Holdings LP and its affiliates (OTCGH); are confidential, may be legally privileged and are intended solely for the use of the individual or entity to whom they are addressed. Unauthorized disclosure, copying or distribution of the Material, is strictly prohibited and the recipient shall not redistribute the Material in any form to a third party. Please notify the sender immediately by email if you have received this email by mistake, delete this email from your system and destroy any hard copies. OTCGH waives no privilege or confidentiality due to any mistaken transmission of this email.