The addition of more renewables to the power stack is adding one more variable to track to keep on top of week-to-week fundamental demand changes. Wind and solar additions directly impact weekly gas burns and ultimately the amount of natural gas that goes in or out of storage daily. Below is data from the EIA-860 report showing the new generation and the retiring generation by fuel type each month. As can be seen, most of the new generation being added is either wind or solar.
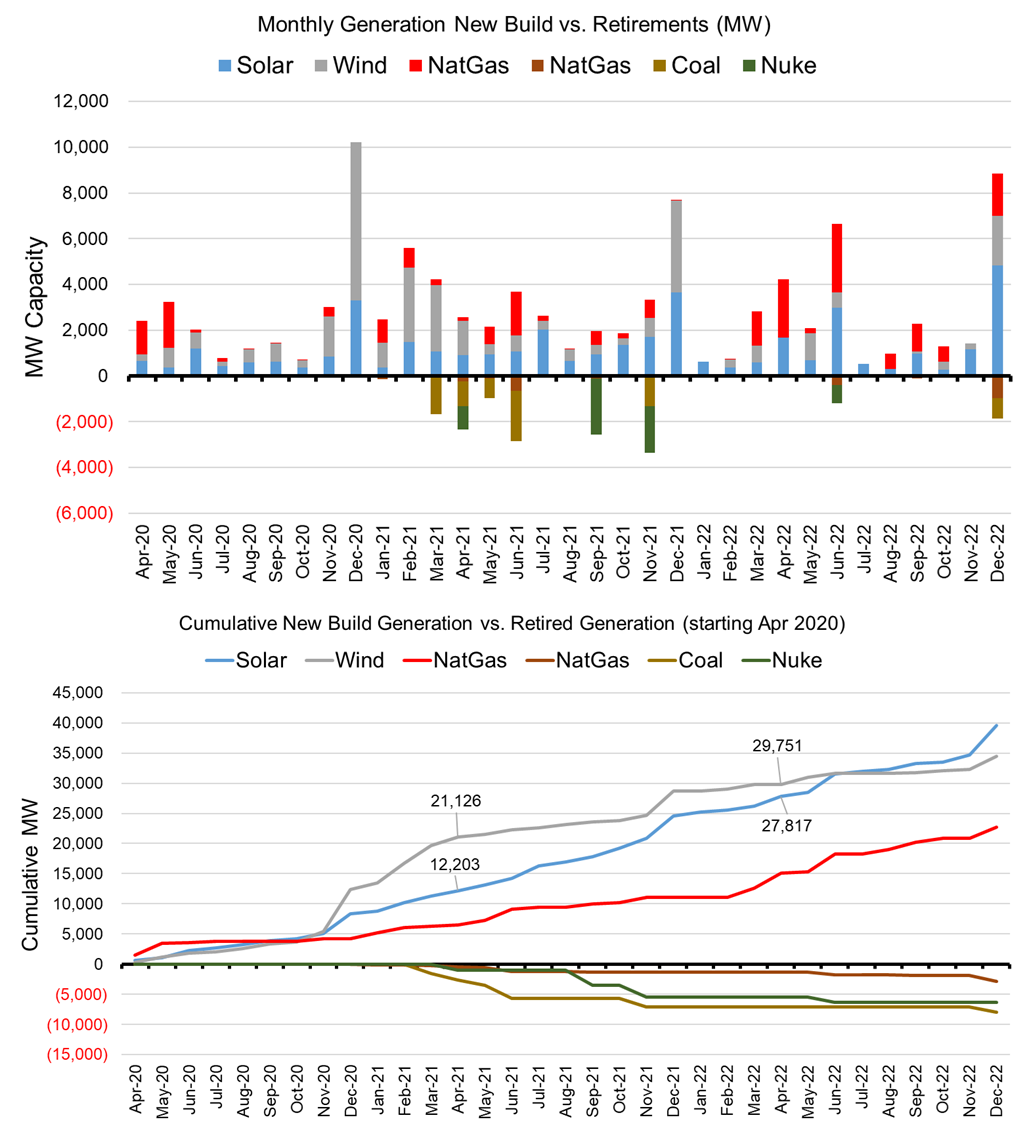
Source: EIA
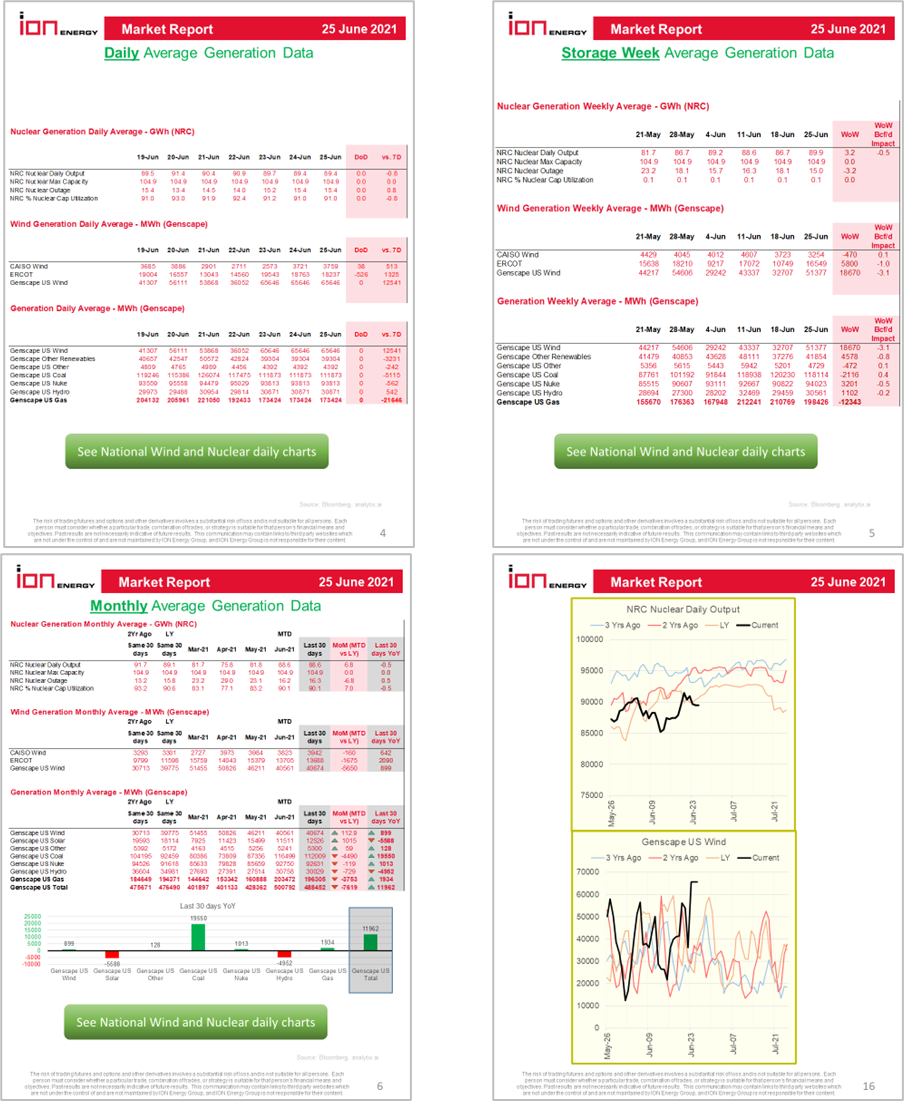
This week we review some new data added to the daily report. Included on pages 4 and 5 will be nuclear daily output data and Genscape generation data by fuel type. With this data, we will now have more visibility on the impacts on gas burns related to varying renewables output and nuclear outages.
The data will be displayed in tabular format to show daily changes vs past years, and also by storage week to show week-on-week changes impacting gas burn levels.
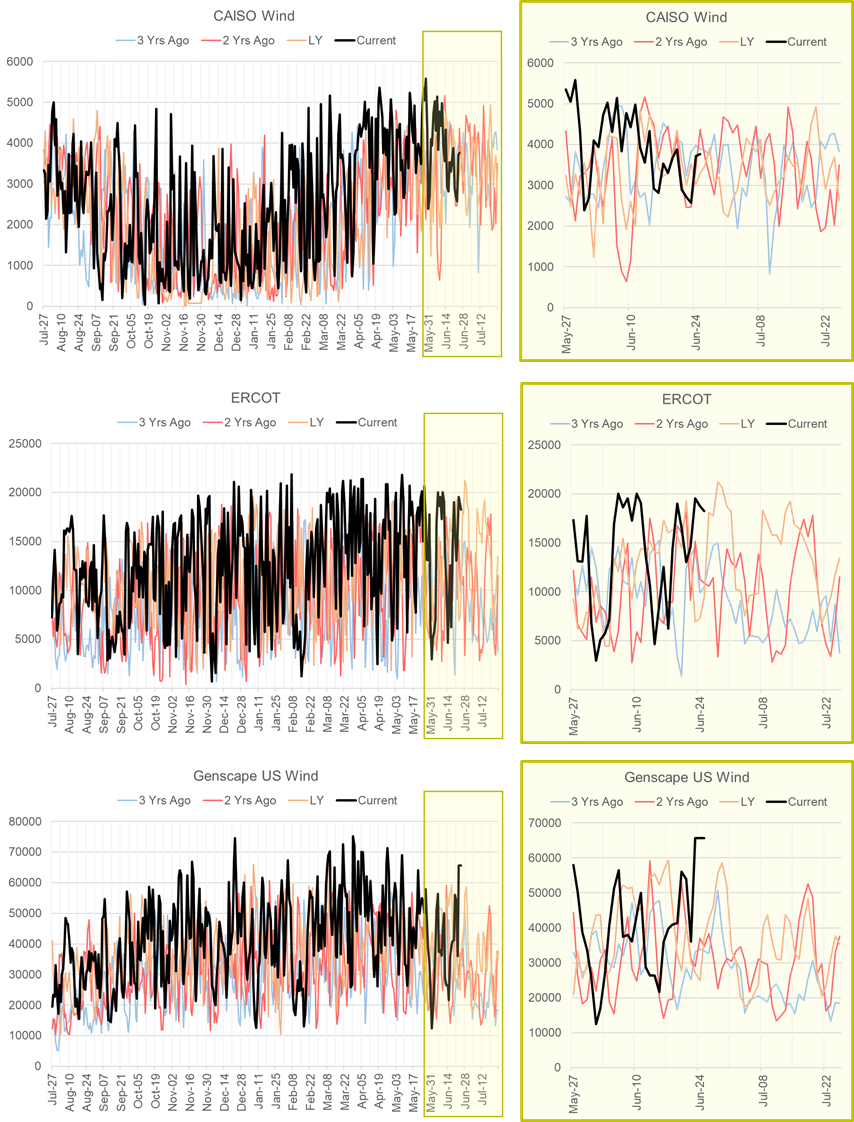
Wind is becoming a very important piece of the power stack. We have good visibility into CAISO, ERCOT, and the national level in the report now. Ultimately, this data can help us understand how the variability in renewable energy will impact real-time gas generation.
(this chart will be shown on page 15)
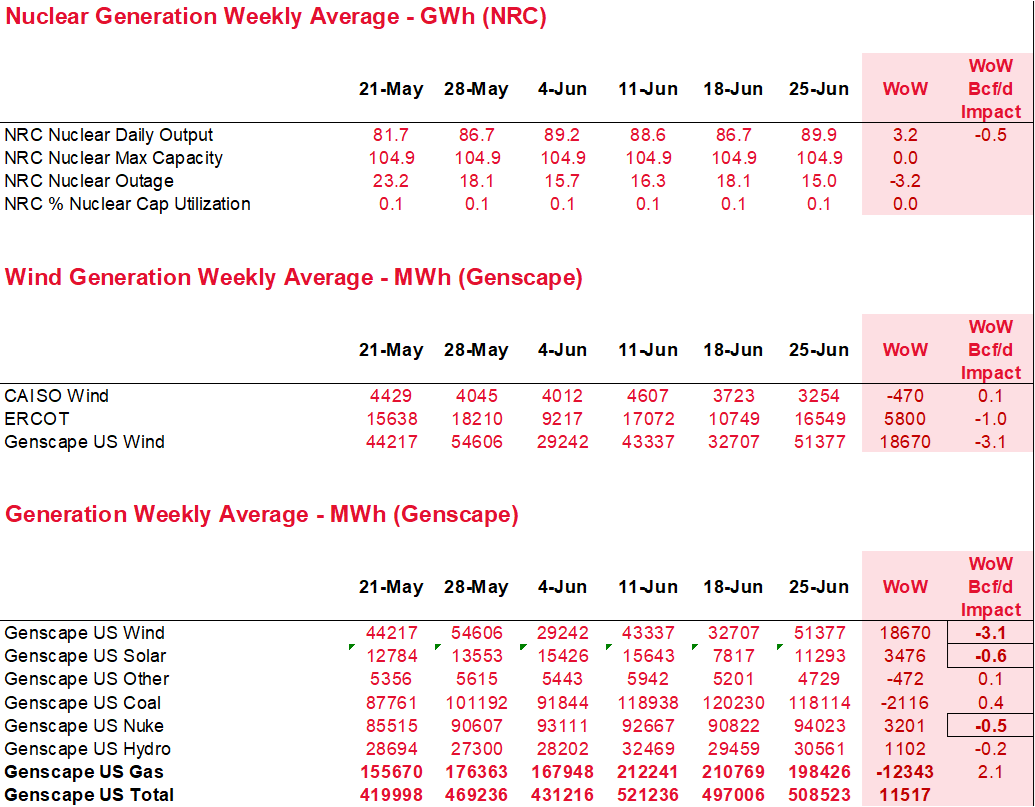
To better understand the gas impact, we have calculated the week-on-week gas burn impact in Bcf/d. We assume a 7.0 heat rate gas plant is on the margin at all times; hence it toggles on and off to correct for the wind and solar variations.
This right-most column in the table below (shown on page 5 of the report) gives us a proxy of how much gas burns were influenced by the delta in renewables generation and nuke outages.
Fundamentals for the week ending June 25: This past week the EIA reported a +55 Bcf storage injection for the week ending June 18th. This report came in ~7 Bcf/d below market consensus and 5 Bcf/d below our S/D model. Unlike last week, which was showed balances being loose vs LY this report came in 3.7 Bcf/d tighter wx adjusted. The market took this report to be quite bullish and it resulted in a 10+ cent rally in price. In fact, prices rose above the levels observed during February’s winter storm Uri.
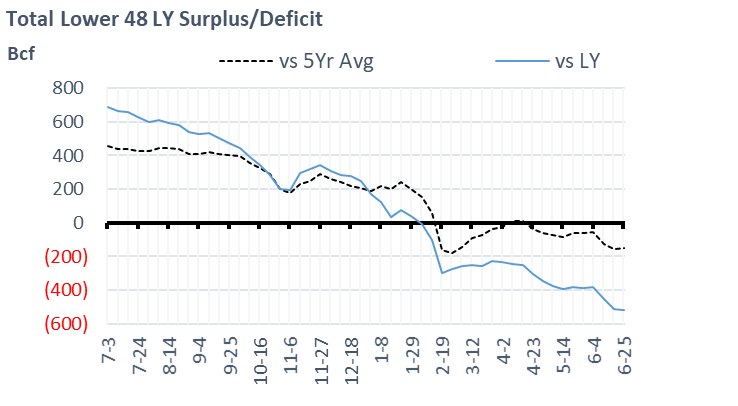
For the week ending June 25th, our early view is +70 Bcf. The 5Yr average is a +65 Bcf injection. Our projected injection would take the L48 storage level to 2552 Bcf (-516 vs LY, -149 vs. 5Yr). As seen in the chart below, the storage levels have gone from a major surplus to a notable deficit.
Domestic production was higher by 0.8 Bcf/d week-on-week with Texas and the Midcontinent adding back some volumes that were lost the previous week. The Northeast saw production near peak levels at 35 Bcf/d earlier in the week despite concerns that the TETCO N-to-S flows would restrict production receipts. Overall production has been steady this summer where it has fluctuated between 92-93 Bcf/d on the most part. We should note that the higher domestic production was mainly offset by lower Canadian imports. Western Canada is experiencing the same level of heat that most of the Western US is getting. In extreme heat scenarios, Alberta and BC production receipts drop as pipeline compressors run at a lower capacity due to the high ambient heat. This phenomenon should continue into next week.
Total consumption was lower this week driven primarily by power burns. Total national temps were higher week-on-week, but the stronger wind helped ease the natural gas generation load. We see total wind generation being 60% higher than the previous week. Total average daily consumption dropped by 2.9 Bcf/d to 70.3 Bcf/d as a result of lower power burns and industrial load.
Deliveries to LNG facilities averaged 10.3 Bcf/d, which was +0.7 Bcf/d higher than the previous week. The increase comes with Cameron resuming normal levels of operation.
Net the balance is looser by 2.4 Bcf/d week-on-week.
Expiration and rolls: UNG ETF roll starts on July 14th and ends on July 19th.
August futures expire on July 28th, and August options expire on July 24th.
This email, any information contained herein and any files transmitted with it (collectively, the Material) are the sole property of OTC Global Holdings LP and its affiliates (OTCGH); are confidential, may be legally privileged and are intended solely for the use of the individual or entity to whom they are addressed. Unauthorized disclosure, copying or distribution of the Material, is strictly prohibited and the recipient shall not redistribute the Material in any form to a third party. Please notify the sender immediately by email if you have received this email by mistake, delete this email from your system and destroy any hard copies. OTCGH waives no privilege or confidentiality due to any mistaken transmission of this email.