This past week the EIA released the L48 monthly supply & demand for December 2021 to finally give a full view of 2021. It was quite the year with wild weather, low coal stock and strong power burns, low hydro, fluctuating wind, stagnant to rising production, and the list goes on. All this resulted in one of the most volatile years for natural gas price.
We have taken this data and published it in a number of interactive charts that you can play around with. Drop me a line at het@analytix.ai if you want the keys to these interactive charts to play around.
Let’s start with a YoY table followed by all the interesting charts.
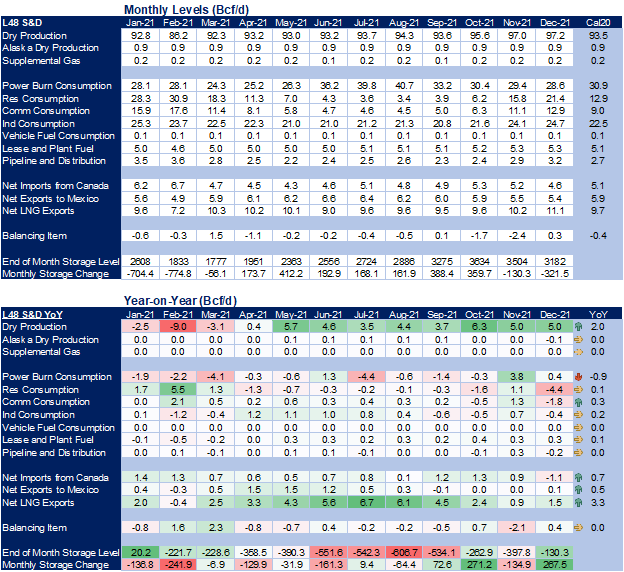
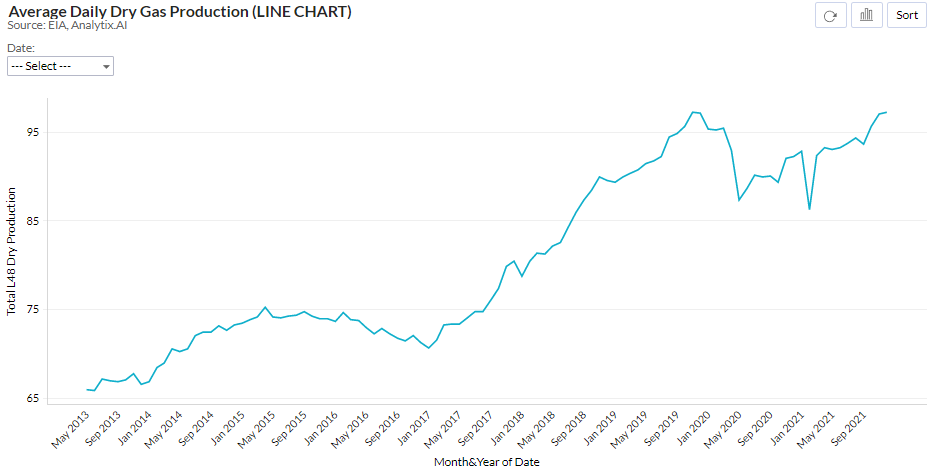
Production:
L48 dry gas production closed the year at the same record level reached in Nov 2019. We are likely to see some new highs in 2022 as freeze-offs roll away, and continued growth in rigs (with oil and gas prices well above key shale region breakeven costs)
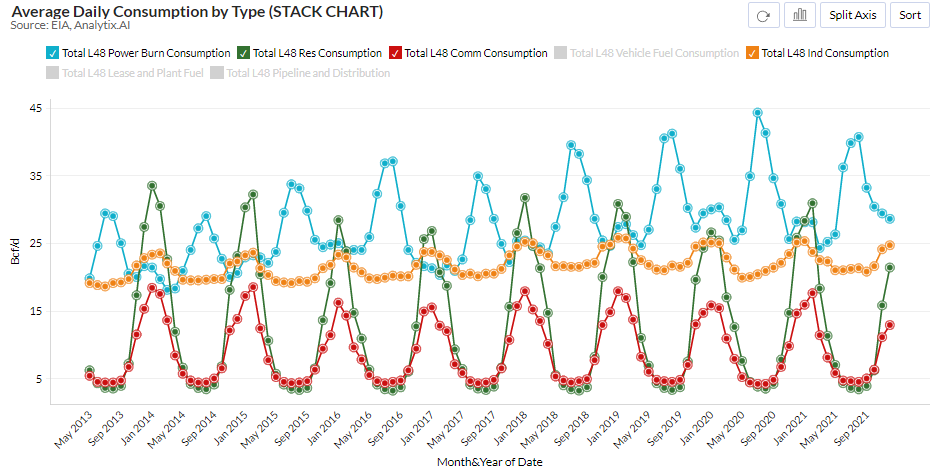
Consumption: All eyes will be on consumption this year. Not specifically ResComm, but power gen and industrial. Power generation will be impacted by the continued low coal stocks and potentially low hydro year (again). Last year we saw incredible gas burns even as gas prices jumped through the summer. Industrial will be another interesting factor to track as the US fires back up after a few COVID years.
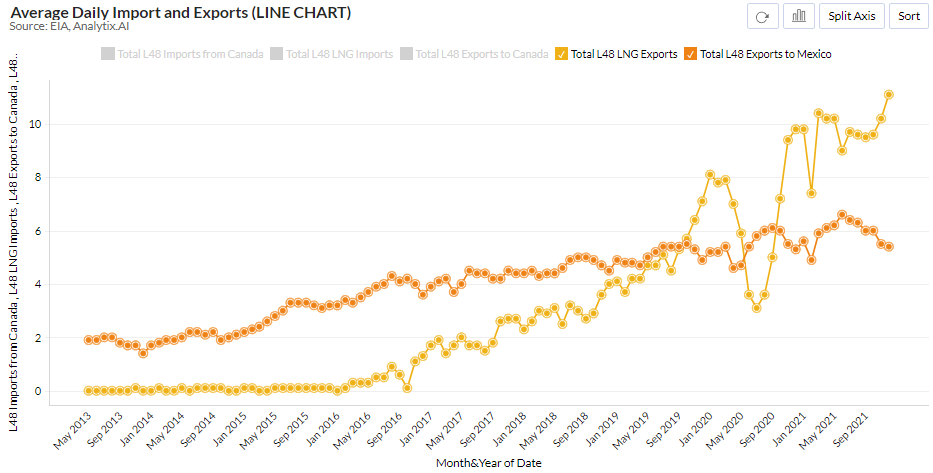
Exports: Both LNG and Mexican pipe exports continue to grow last year with new records. We expect this trend to continue as new LNG capacity comes online, and wide global gas spreads continue to keep LNG terminals operating at strong levels. The piped gas to Mexico will also increase as a result of these wide LNG arbs and growing domestic Mexican pipe infrastructure (why send gas via LNG when you can flow it via pipes).
[There are some additional seasonality charts for power, industrial, and LNG in the attached pdf report]
Fundamentals for the week ending Mar 04:
The EIA reported a -139 Bcf withdrawal for the week ending Feb 25th, which came in line with market estimates.
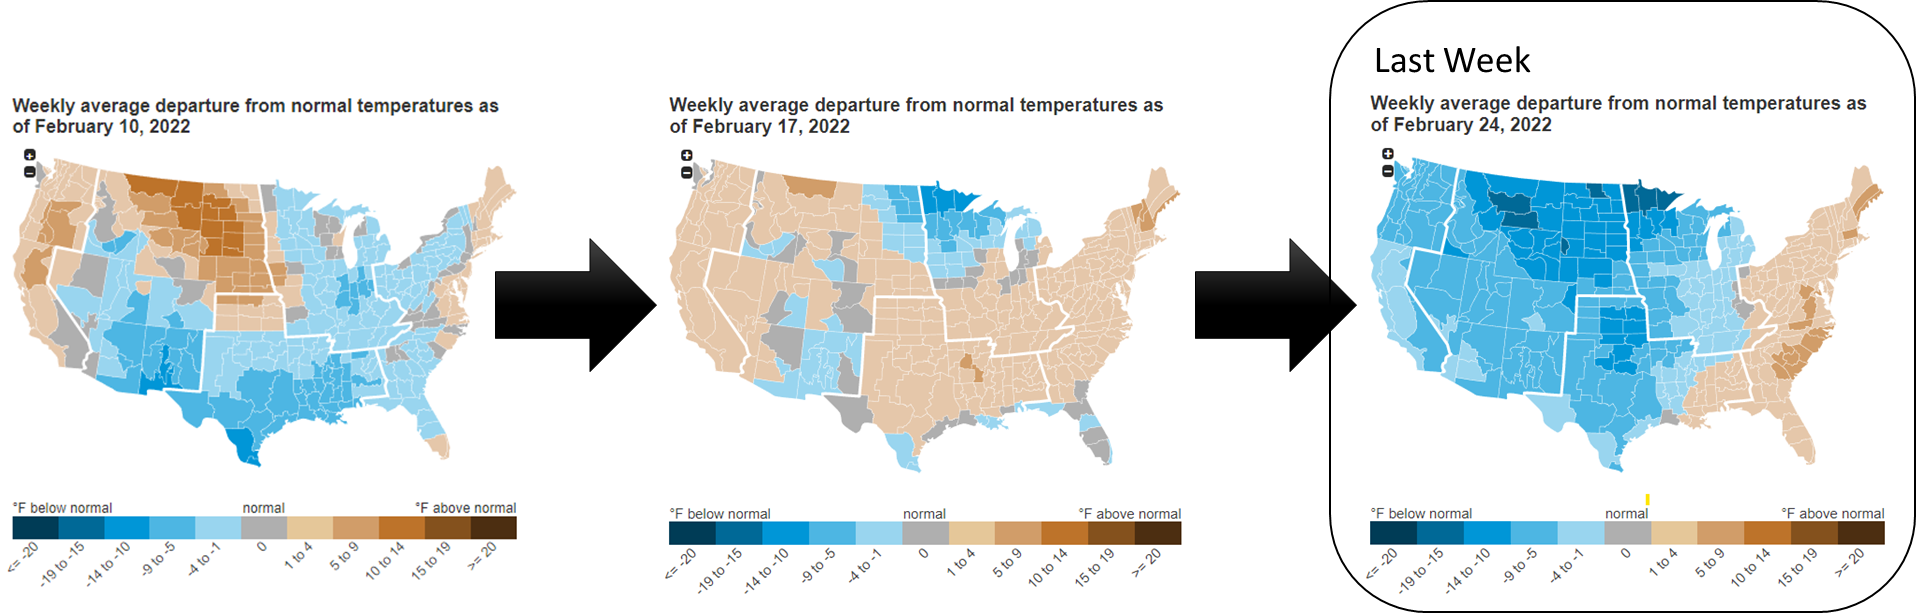
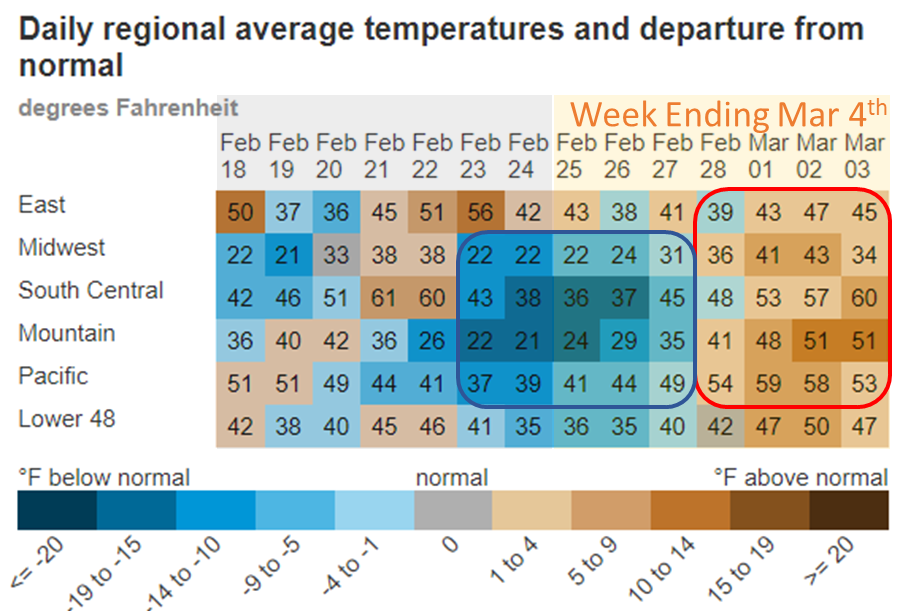
For the reported week, the weather made a shift to cooler across the entire country except for the Eastern seaboard. This led to tighter daily balances as production freeze-offs were seen in West TX/Midcon and we had strong rescomm demand (+1.7 Bcf/d WoW). The drop in LNG deliveries due to the Freeport power outage and strong wind helped keep the storage draws lower than we would have otherwise seen.
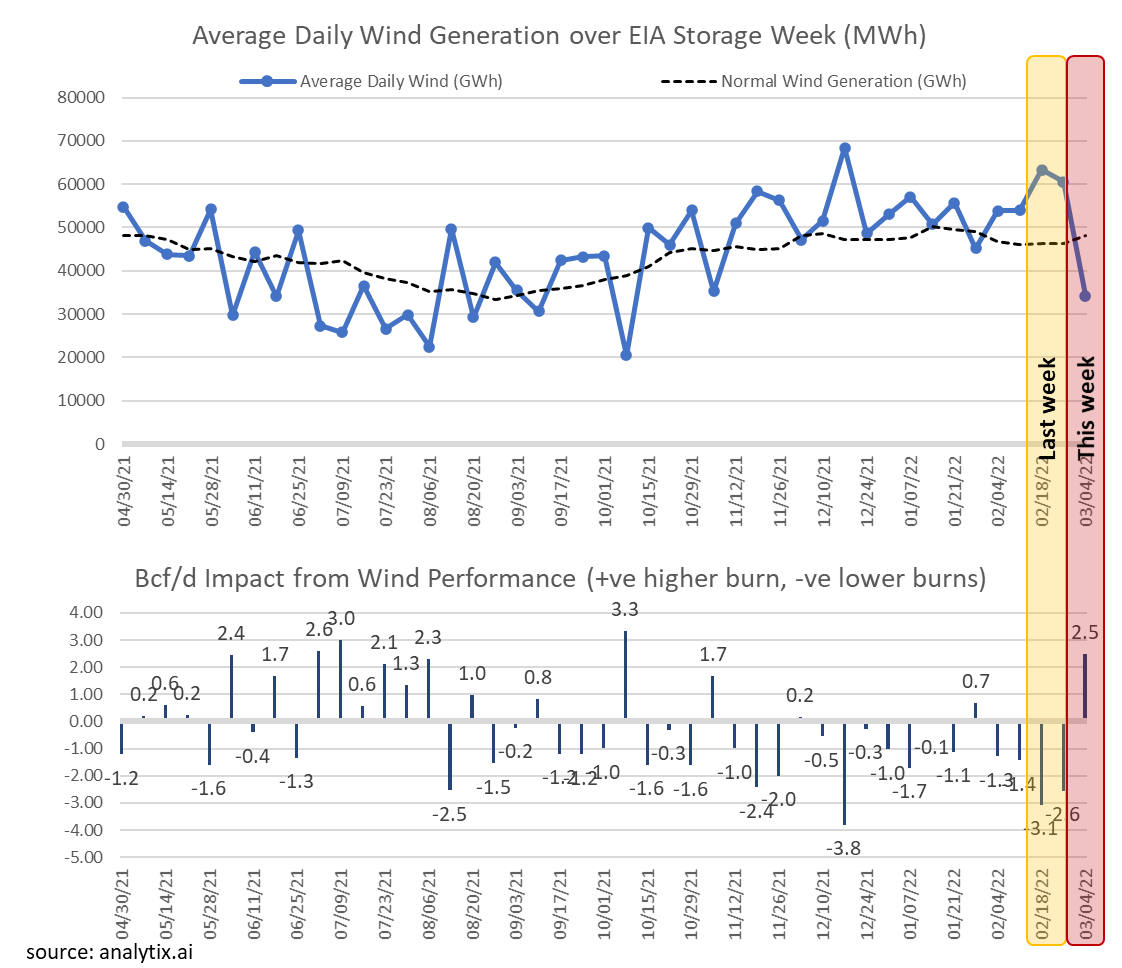
This past week’s report continues to point to the tight market conditions. We estimate this report was 2.5 Bcf/d tight vs LY (wx adjusted). Last week’s balances would have been tighter if it had not been for the continued strong wind. Wind averaged 60.5 GWh on average during the week.
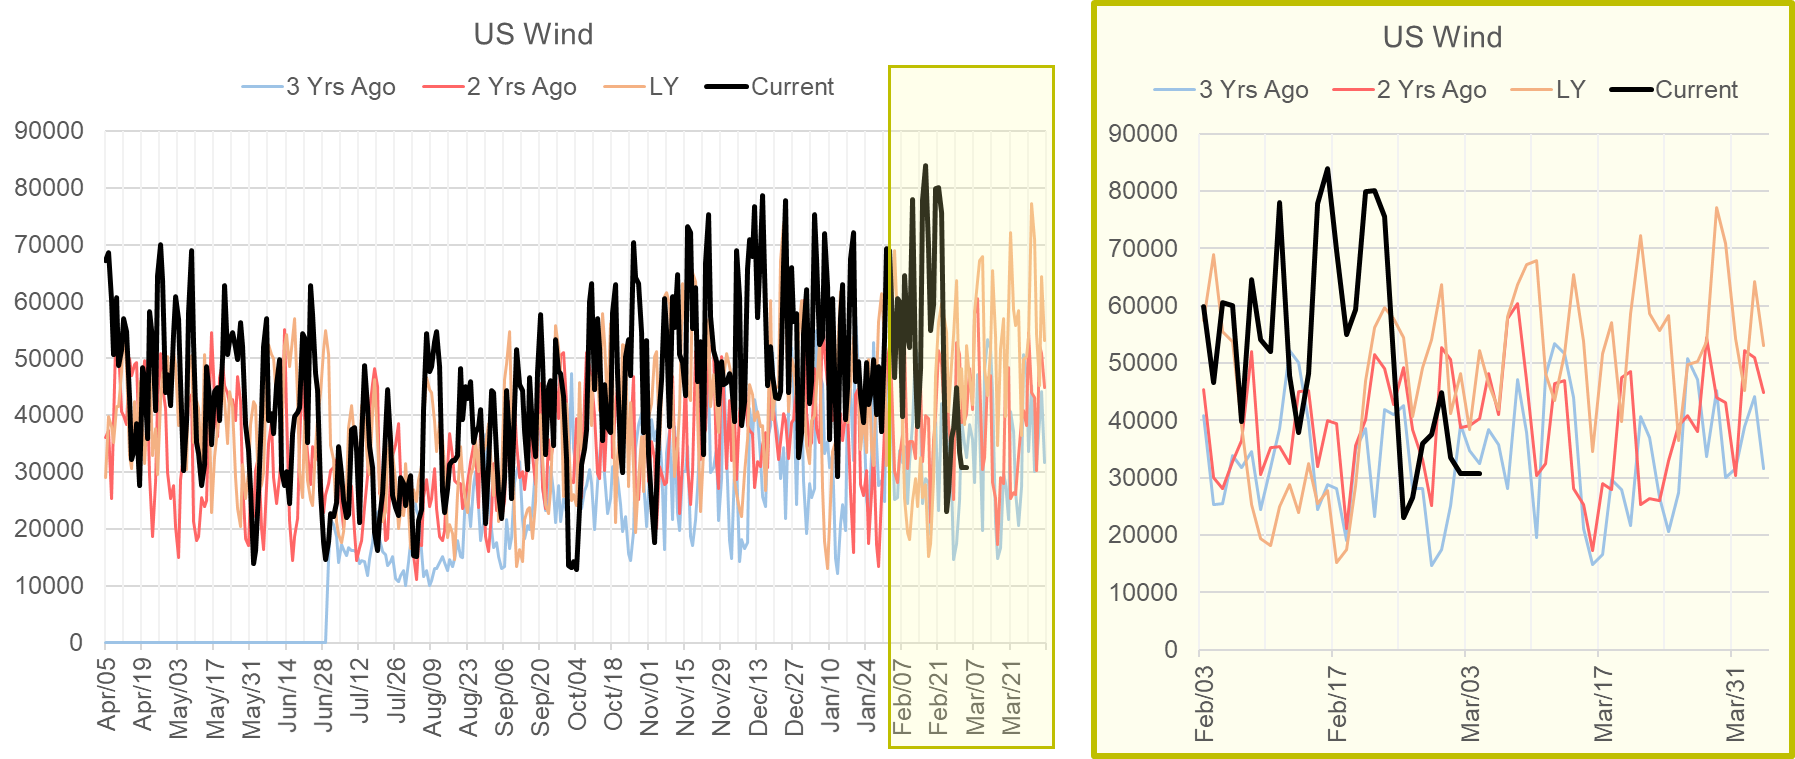
Adjusting this week’s storage report to more normal wind conditions, we estimate this report was actually 6 Bcf/d tight vs LY (wx adjusted). Now to week ending Mar 4th, which had very low wind generation.
For the week ending Mar 4th, our early view is -136 Bcf. This reporting period will take L48 storage level to 1,507 Bcf (-216 vs LY, -255 vs. 5Yr).
This week we see total consumption dropping with a big shift in weather. Temps across the country closed the week well above normal levels. The net result was L48 GWHDD dropping by +1.9F relative to the previous week; resulting in a 2.8 Bcf/d drop in natural gas consumption for space heating (rescomm only).
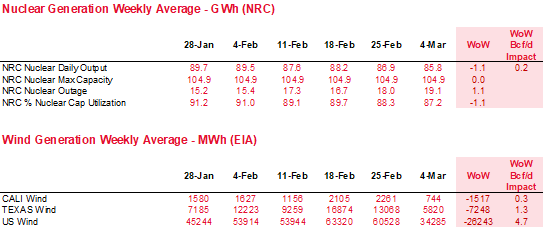
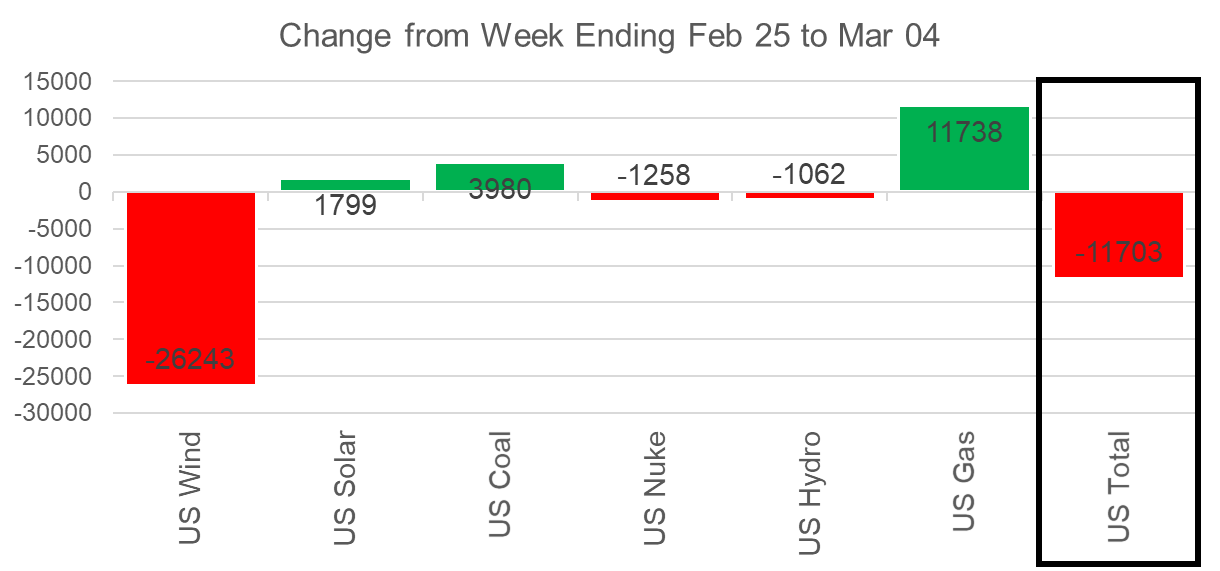
On the power generation side, the story changed quite dramatically week-on-week. After two consecutive weeks where wind generation was well above normal, this week we saw a steep decline in wind levels. Wind generation levels across the country dropped by 43% to an average of 34 GWh. This level is 29% below normal.
Also to note this week is the seasonal drop in nuke generation. Total nuke generation dropped by 1.3 GWh to an average of 90.2 GWH during the week. Although this is not substantial, this level will continue to drop until the third week of April by another 10 GWh.
Both the above are notable this week, as we see natural gas power burns increase by up to 2.1 Bcf/d even as total power load dropped by 2.6% or 11.7 GWh. The chart below shows the week-on-week change in the generation mix.
As we noted above, the wind gen collapsed this past week after being strong for week ending Feb 18th and Feb 25th.
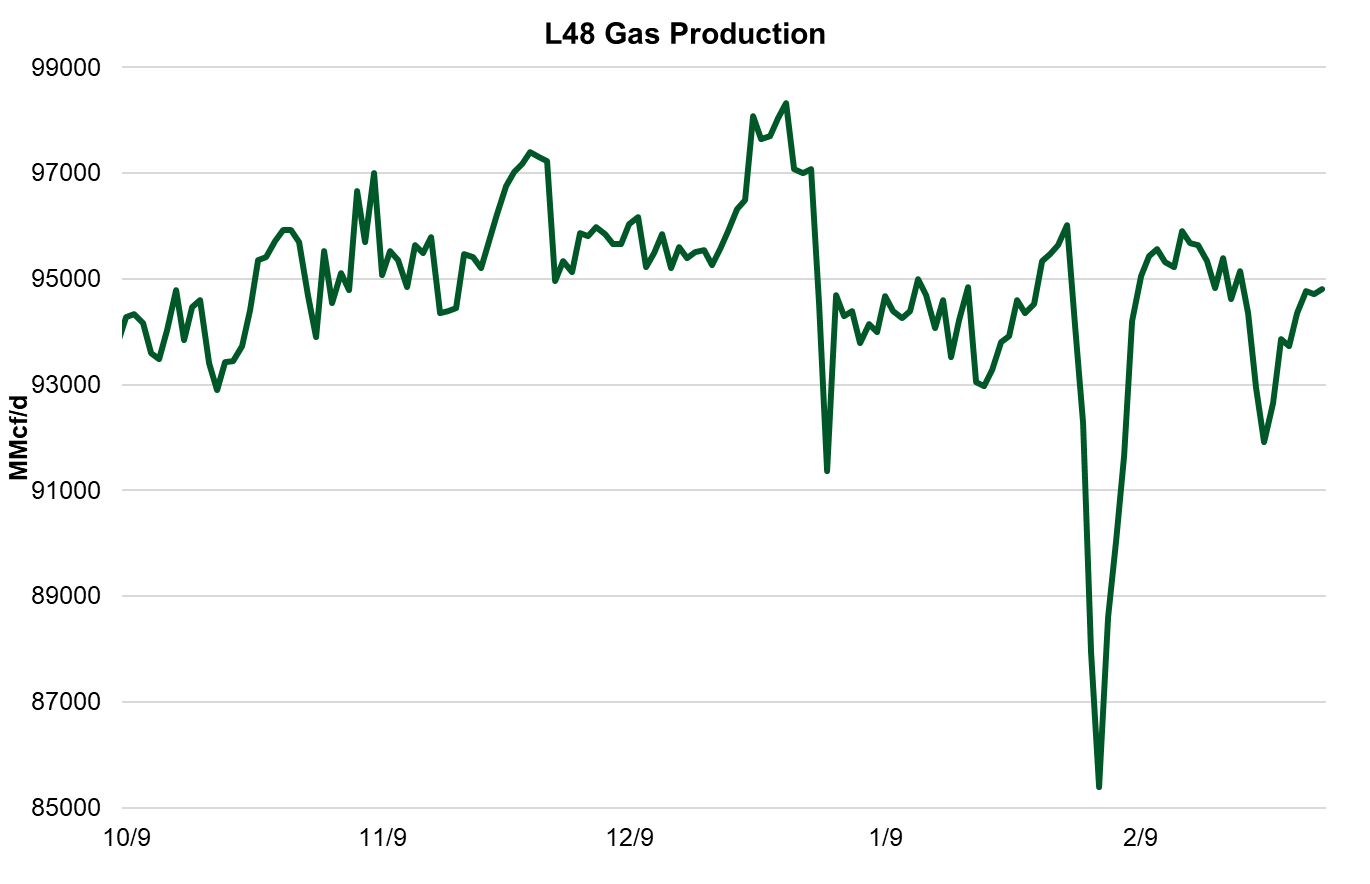
Domestic dry gas production was flat this week as the cooler weather bled into the start of this week. The Permian to the Anadarko experienced lower production at the beginning of the week but started to resume to more normal levels as the weather warmed up. Production increased from 92.6 Bcf/d at the start of the week to 95.6 Bcf/d by end of the week. This is a 3.0 Bcf/d turnaround.
With warm weather in March coming soon, we expect Northeast basins to finally bring some production back online.
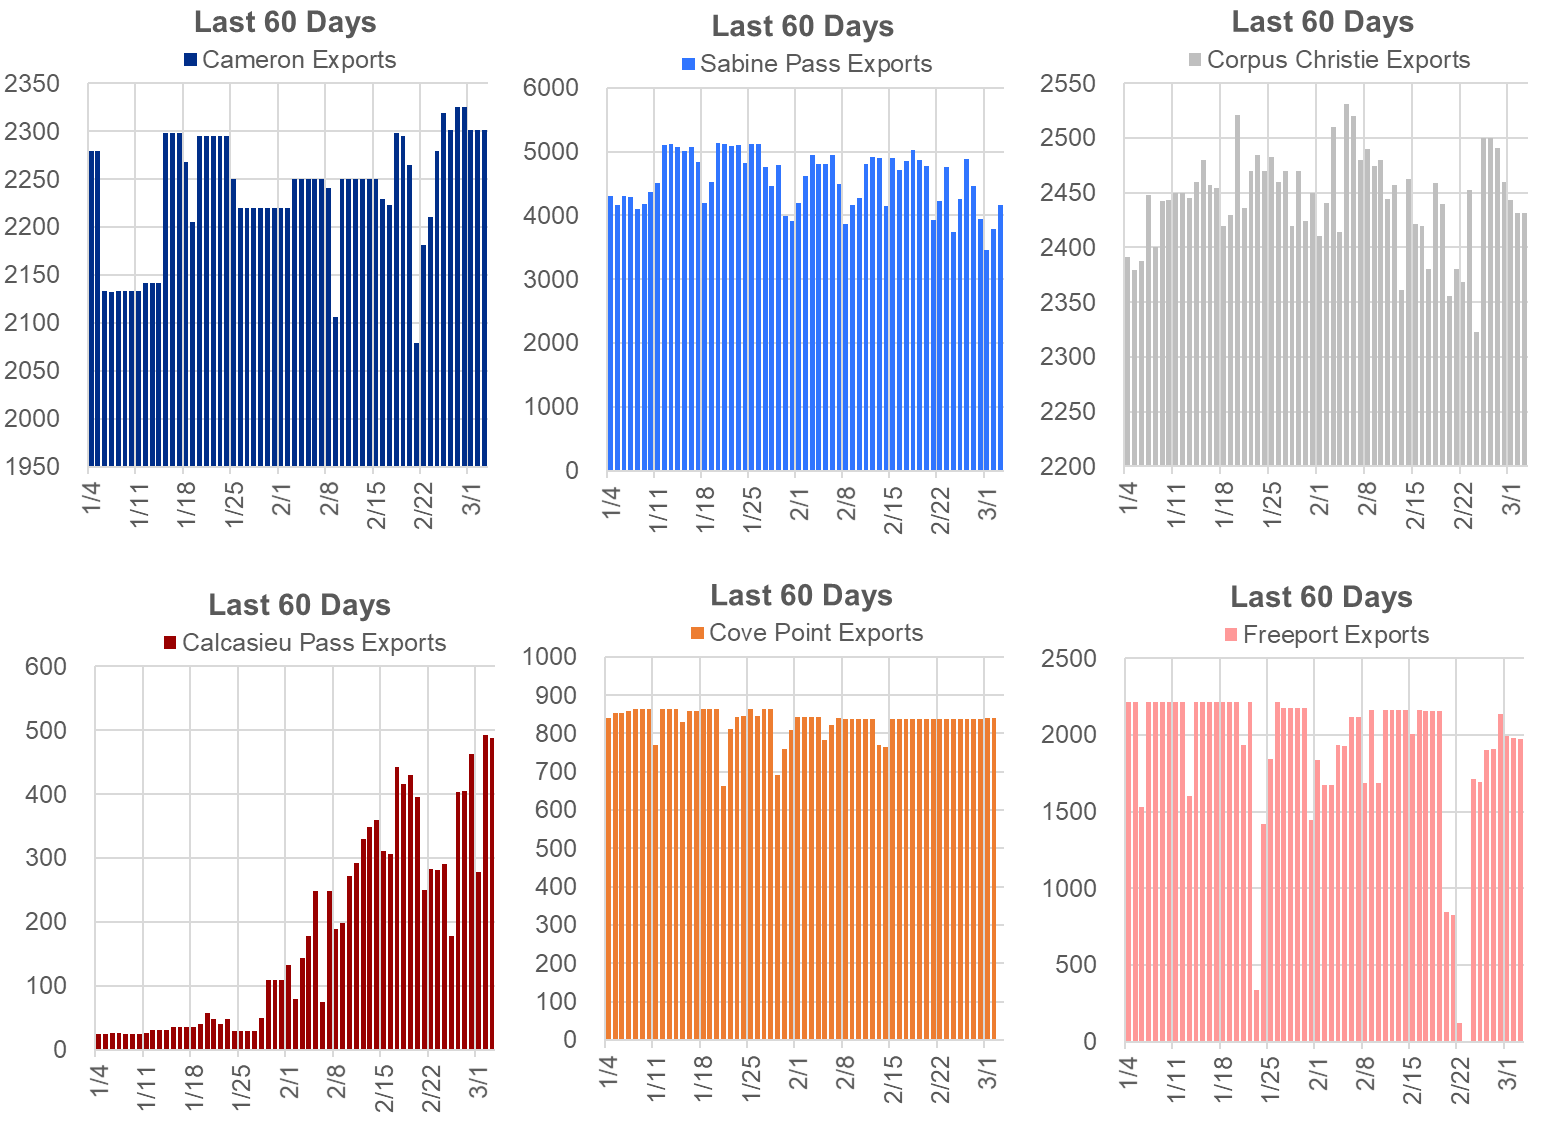
Deliveries to LNG facilities averaged 12.5 Bcf/d, which was 0.8 Bcf/d higher than the previous week. The return of Freeport was the biggest notable event. The facility was down due to a power outage that started on Feb 20th. Sabine Pass did have lower deliveries that offset the rise from Freeport. We are not aware of any issues at the Sabine plant, but receipts from NGPL and Kinder Morgan Louisiana were the two feeder pipes that were delivering less to the facility.
To finish off, here is a good stat I found in the Twitterverse: Twenty-four #LNG vessels (nine from Sabine Pass, five from Corpus Christi, three each from Cameron and Freeport, two from Cove Point, and one each from Elba Island and Calcasieu Pass) with a combined LNG-carrying capacity of 92 Bcf departed the U.S. between Feb. 24 and March 2.
The net balance was 0.5 Bcf looser week-on-week.
This email, any information contained herein and any files transmitted with it (collectively, the Material) are the sole property of OTC Global Holdings LP and its affiliates (OTCGH); are confidential, may be legally privileged and are intended solely for the use of the individual or entity to whom they are addressed. Unauthorized disclosure, copying or distribution of the Material, is strictly prohibited and the recipient shall not redistribute the Material in any form to a third party. Please notify the sender immediately by email if you have received this email by mistake, delete this email from your system and destroy any hard copies. OTCGH waives no privilege or confidentiality due to any mistaken transmission of this email.