This past week, the EIA released their latest drilling productivity report (DPR) which includes their forecast for March and April.
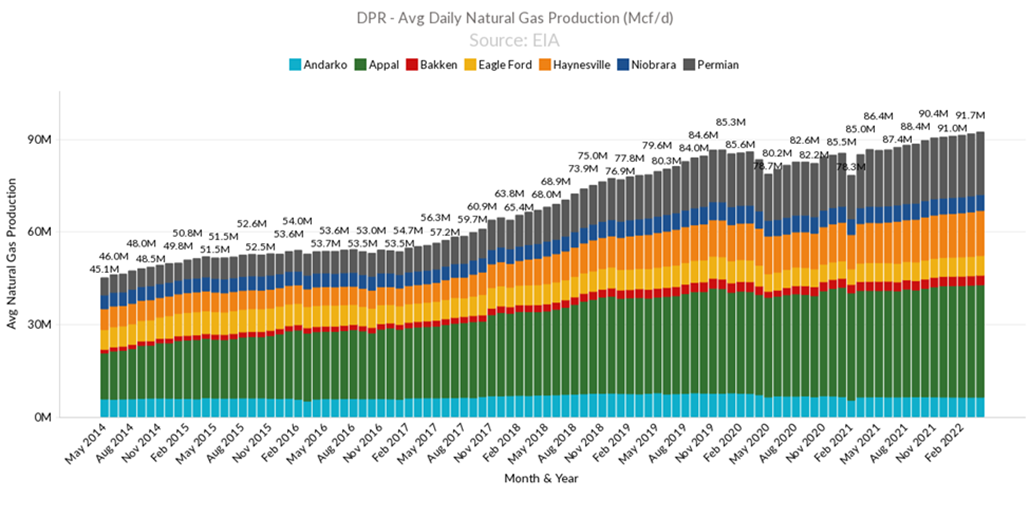
The DPR revised natural gas shale production slightly higher in March to 91.73 Bcf/d (slightly higher than the previous March estimate of 91.68 Bcf/d). April natural gas production levels are slightly higher at 92.33 Bcf/d. Speaking to analysts at the EIA, we gather that these are wellhead gas estimates (ie. not dry gas volumes) and there are no adjustments for freeze-offs made to the forward-looking volumes.
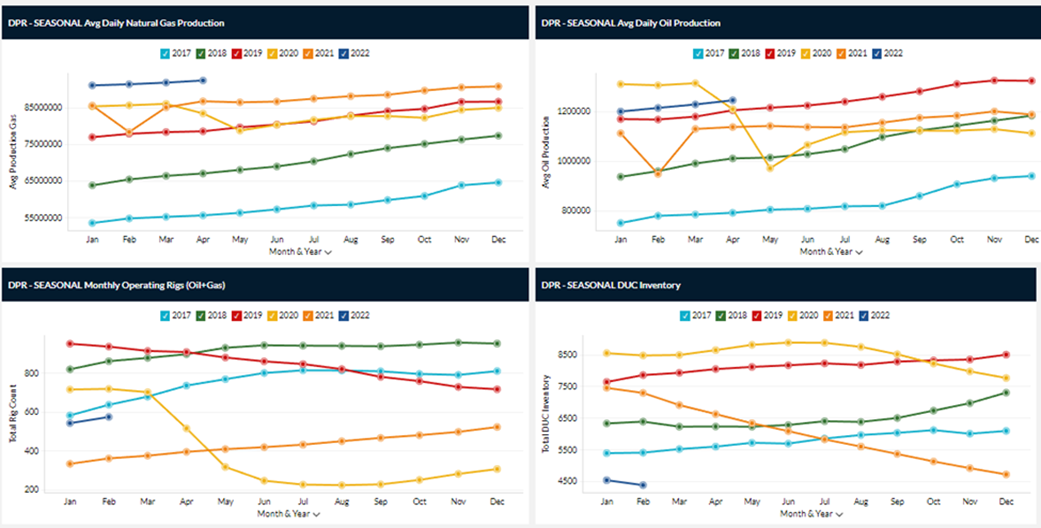
[All the DPR charts come from our EIA DPR dashboard which lets you filter by region, date, and download the raw data. Drop me a line at het@analytix.ai to check it out]
The two biggest gas-focused regions, Appalachia and Haynesville, are expected to see big hikes in April. Appalachia will grow by 186 MMcf/d to 36.48 Bcf/d, and the Haynesville Shale will rise by 173 MMcf/d to 14.60 Bcf/d. Meanwhile, the Permian will grow by 120 MMcf/d to 20.28 Bcf/d, and the Eagle Ford by 94 MMcf/d to 6.382 Bcf/d.
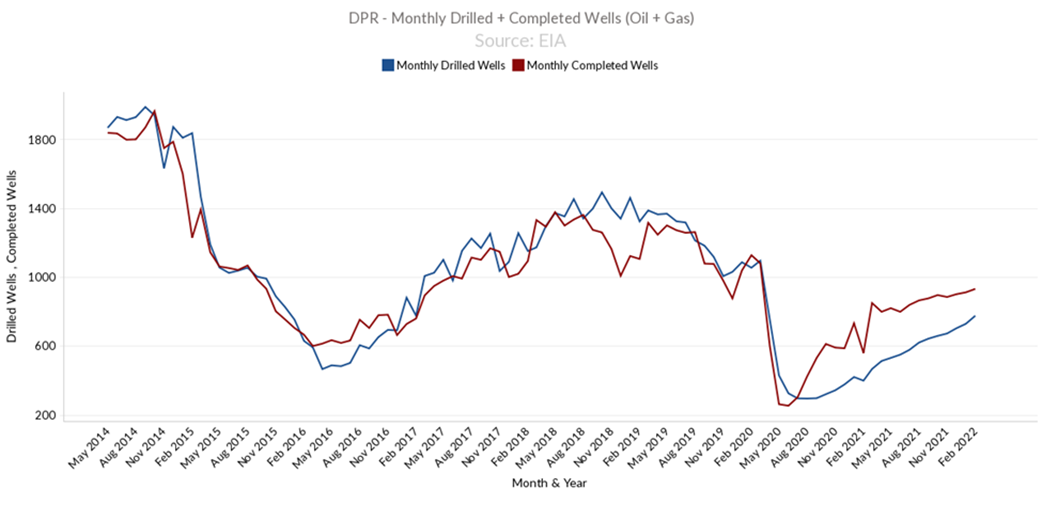
The growth is occurring amid increasing drilling activity and spending hikes with front-month crude oil futures trading above $100/b. That being said, the short-term production gains would still heavily rely on DUCs. The chart below clearly shows that there is a gap between monthly completed wells and drilled well. This reliance on DUCs started with the onset of COVID and dropping energy prices. In Oct 2020, drilled well made up only 52% of total completed wells. Today with increasing energy prices, producers are starting to deploy rigs (but only to specific regions) and drill at a faster rate. Today, that number has trended up to 82% of completed wells being drilled.
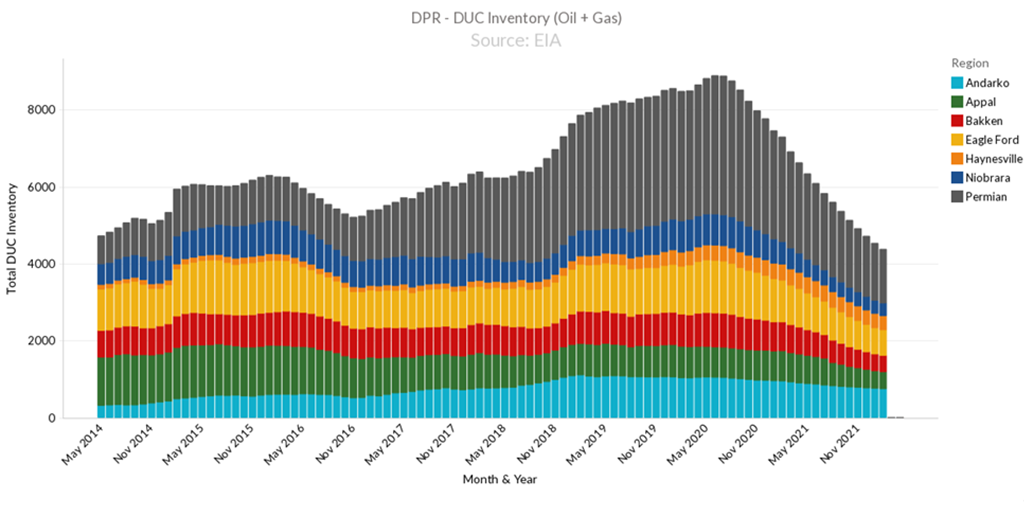
Luckily we had a large inventory off DUCs to manage the number of completed wells required each month to keep production somewhat stable, but as can be seen, the level of DUC is falling off fast. The biggest drawdown in DUC is seen in the Permian which currently has 1396 DUCs from 3590 in June 2020.
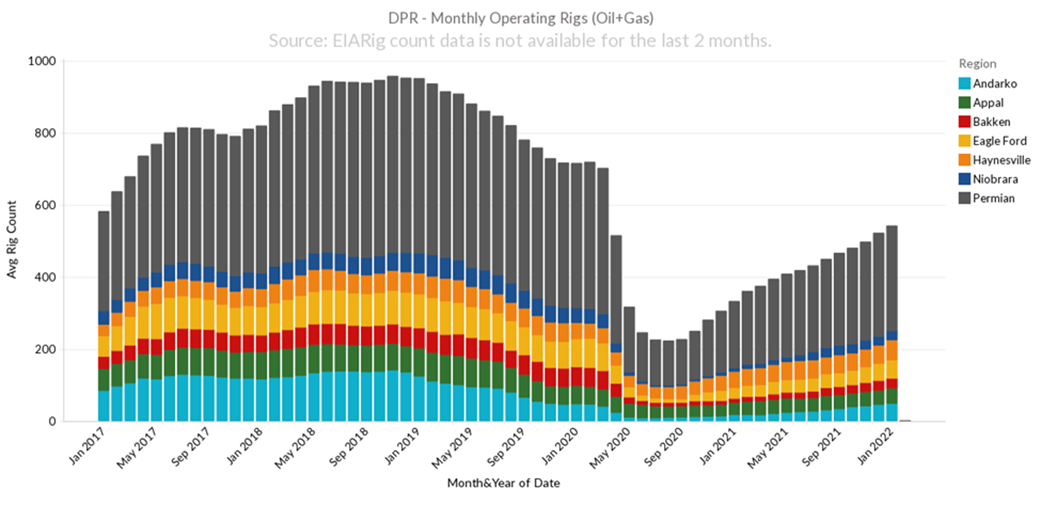
While the active drilling rig count is steadily growing, the pace of bringing new production online is still being constrained workforce (frac crews) and supply chain issues. At the moment all those resources are going to oil-focused regions where netback is much better.
All the data can be seen in seasonality charts by region in the dashboard.
Here are some weather bits from Maxar’s Weather segment on enelyst:
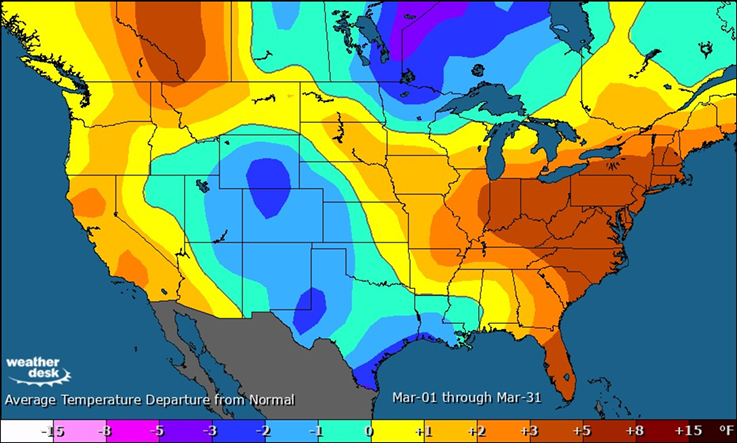
March is forecast to total 550 GWHDDs, which is lower than normal (10-year is 591; 30-year is 620) and would rank as the 9th warmest back to 1950. Last year was slightly warmer than is currently forecast this month, ranking 7th warmest on record with 539 GWHDDs
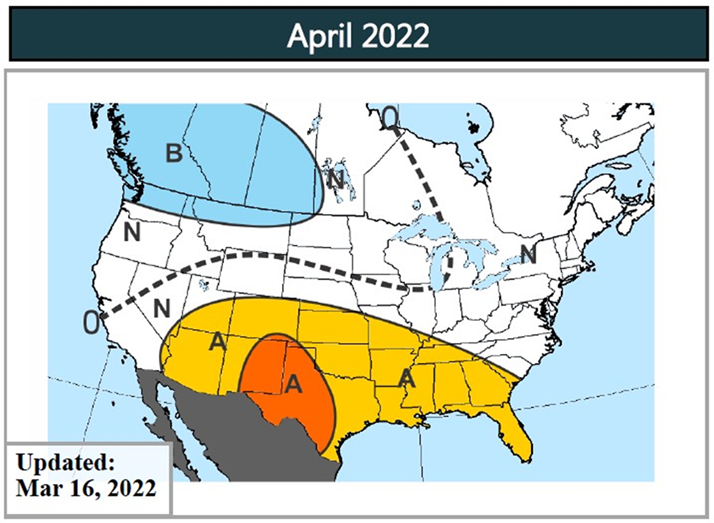
The April outlook has not changed. Maxar is still calling for a warm and dry month in those drought-affected areas from the Southwest to Texas.
Fundamentals for the week ending Mar 18:
The EIA reported a -79 Bcf withdrawal for the week ending Mar 11th, which came slightly higher than market estimates. Storage levels were reported to be 1440 Bcf.
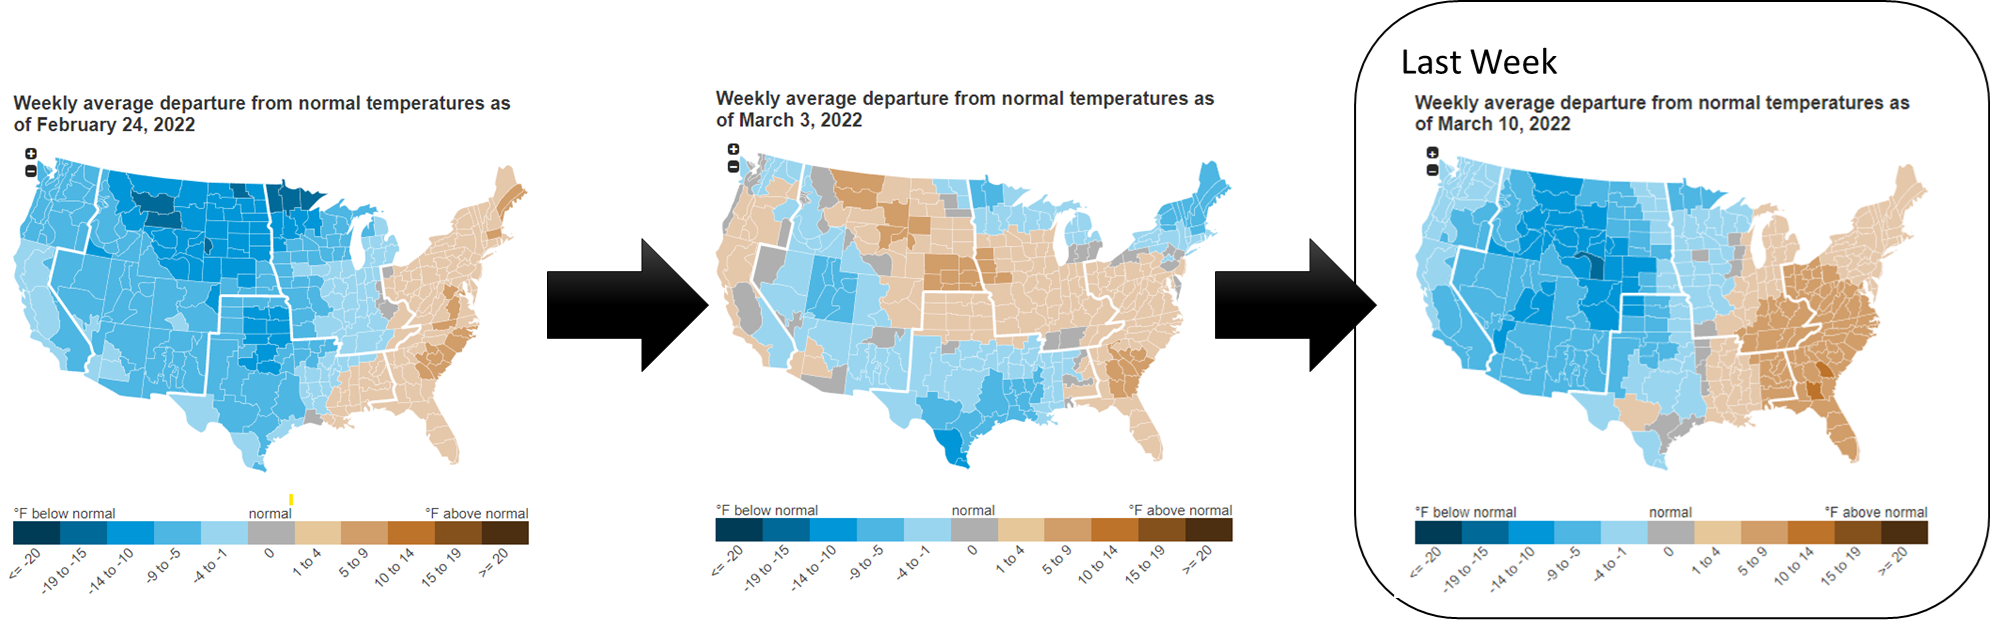
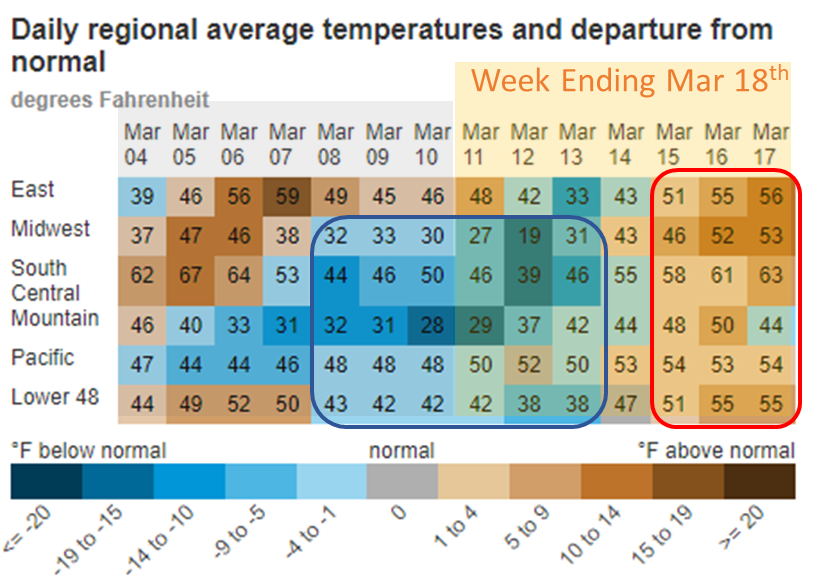
For the reported week, total consumption dropped with warming weather across the Eastern half of the country and rising wind. The net result was L48 GWHDD dropping by -3.0F (despite the Center to West falling below normal) relative to the previous week; resulting in a 7.2 Bcf/d drop in natural gas consumption.
Adding to the week-on-week bearish sentiment was the big change in wind generation for the storage week. Wind generation rose to 57 GWh during the week after falling to 36 GWh the week prior. We calculate ~52 GWh to be the expected norm for this time of the year.
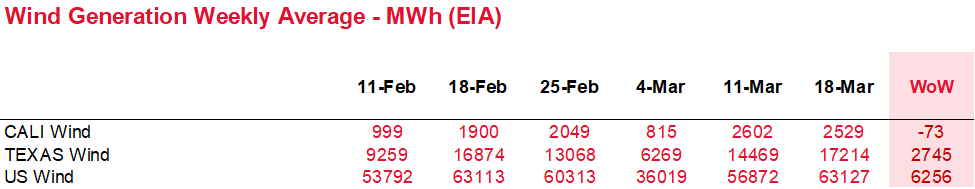
This past week’s report continues to point to the tight market conditions. We estimate this report was ~4 Bcf/d tight vs LY (wx adjusted). This embeds the high wind experienced last week. With wind at normal levels, this report would have been closer to 5.0 Bcf/d tighter vs LY (wx adjusted).
For the week ending Mar 18th, our early view is -55 Bcf. This reporting period will take L48 storage level to 1,385 Bcf (-370 vs LY, -297 vs. 5Yr).
This week we see total consumption continue to drop with warming weather and once again rising wind. Temps across the country started the week cooler but closed the week well above normal levels. The net result was L48 GWHDD dropping by -1.3F relative to the previous week; resulting in a 1.7 Bcf/d drop in natural gas consumption for space heating (rescomm only). Industrial consumption also continued to drop this week with a change of -2.0 Bcf/d.
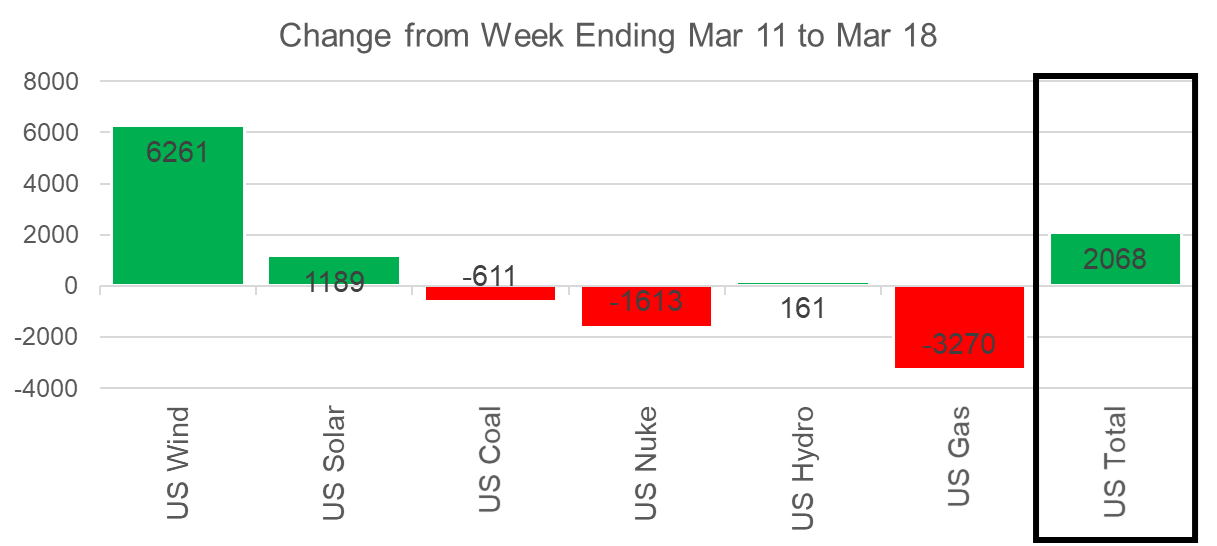
The warming temps and rising wind generation once again pushed power burns lower. The wind generation grew week-on-week by 6.3 GWh on average. If a 7.5 HR natural gas generator was perfectly offset by the increased wind, then we would expect to see a 1.1 Bcf/d drop in power burns.
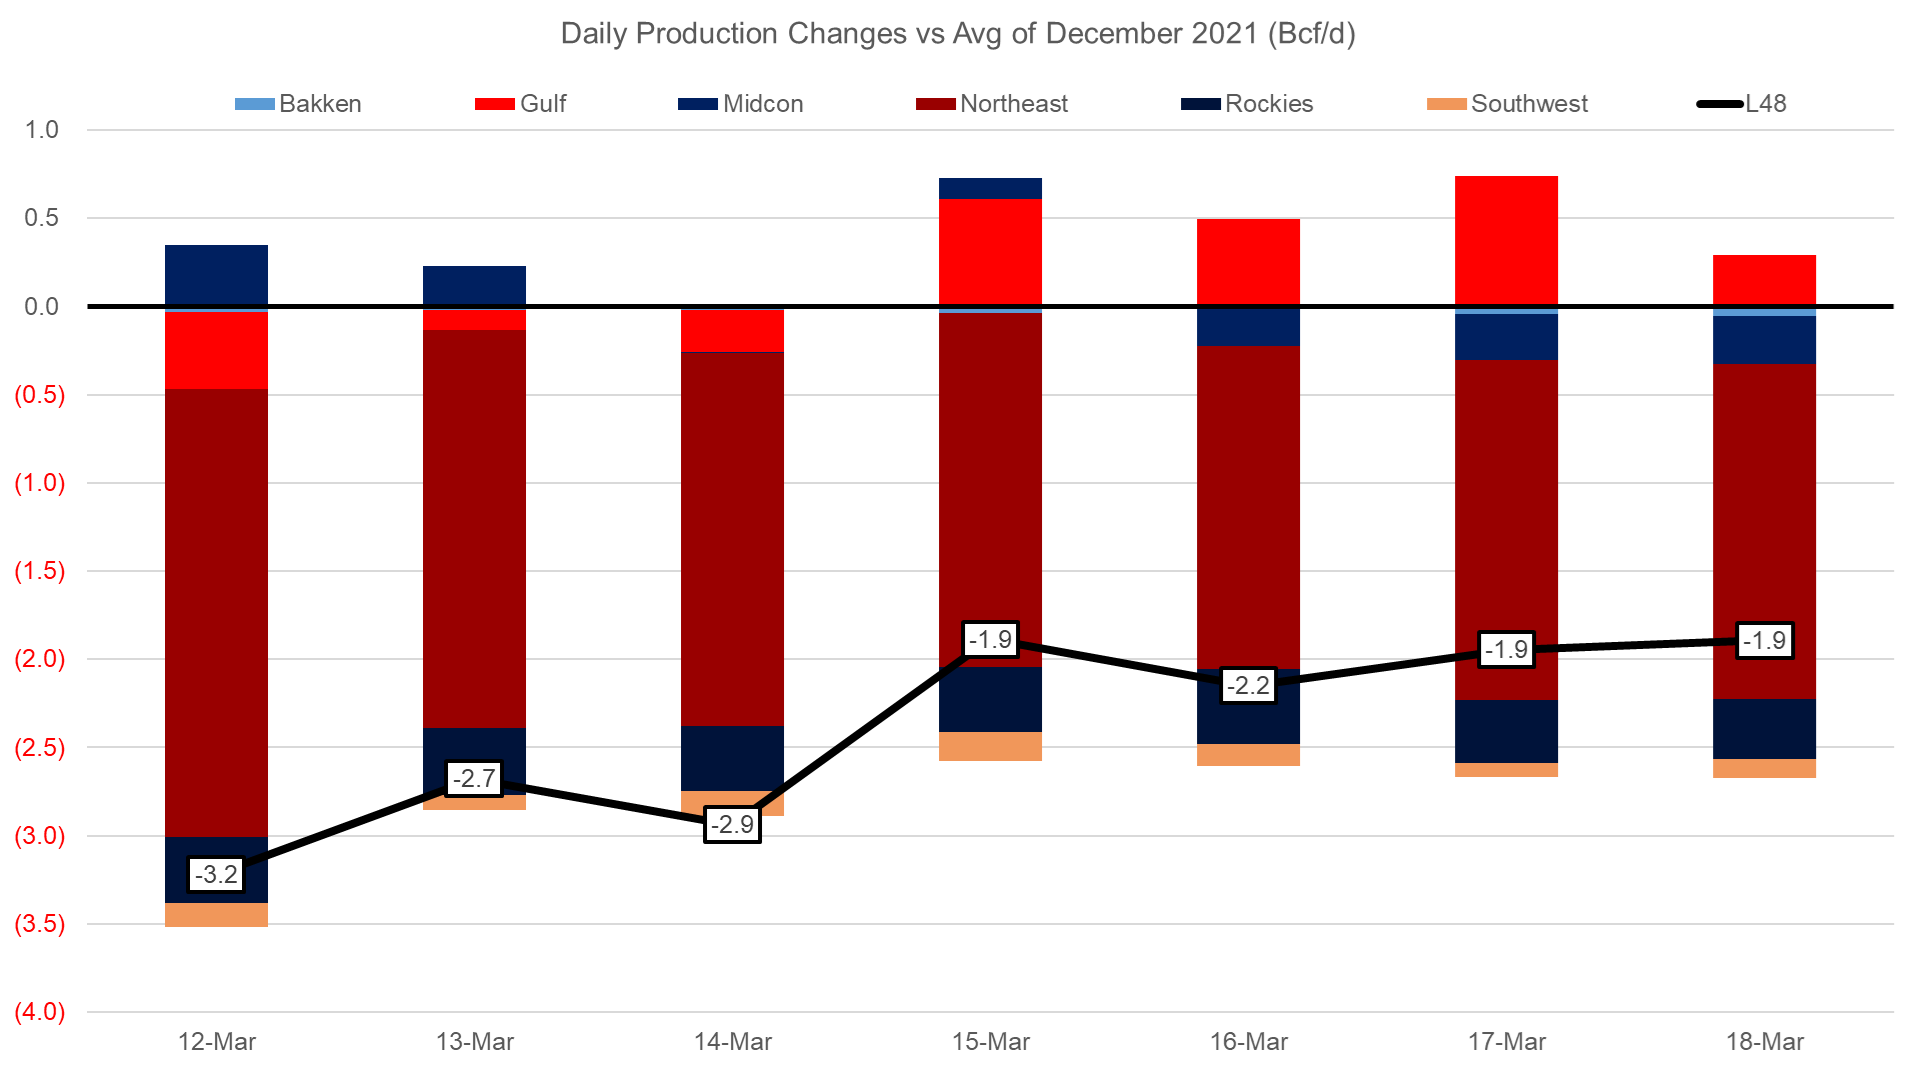
Domestic dry gas production took a hit early last week (Mar 11-14) with near freezing temps across the South pushing production lower in Texas. Total production was off by 1.1 Bcf/d to an average of 93.6 Bcf/d. We have been writing for some time now that we expect freeze-off production in the Rockies and Northeast to unfold – but we have seen no sign of it yet (even with the warm temps across the East coast). This is somewhat concerning because we were anticipating at least 1.0-1.5 Bcf/d of higher production out of the Northeast this winter.
In the chart below, you can see production running much lower than that seen in December 2021. The culprit is purely the Appalachian basin.
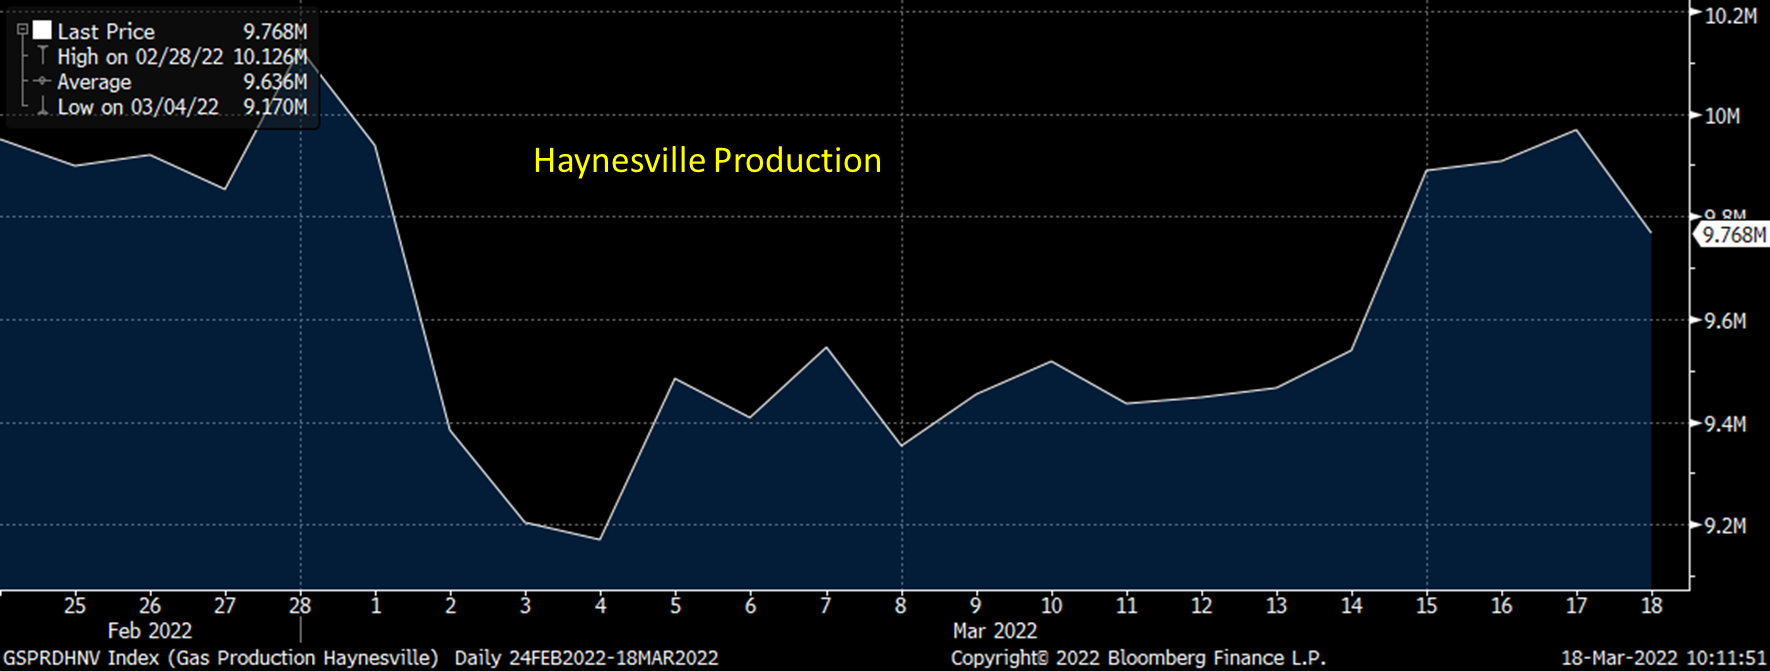
Lastly, we wanted to put out an update on the production drop out of the Haynesville basin. At this point, there is no concrete story, but the rumor is that there was a fire at the Aetheon processing plant (no official statement) in Bienville county. That being said, we have seen production rise starting Mar 15th. Here is the current view on Haynesville production.
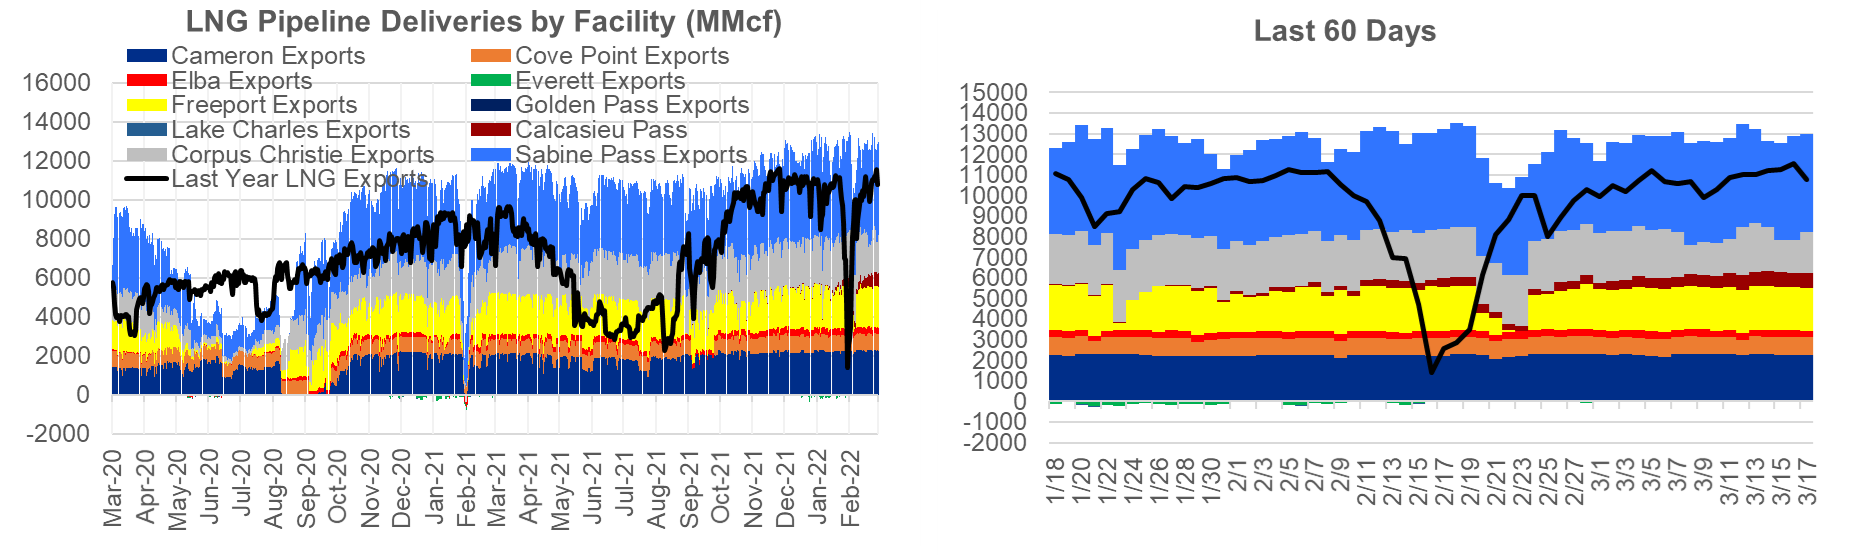
Deliveries to LNG facilities averaged 12.9 Bcf/d, which was 0.1 Bcf/d higher than the previous week. Corpus Christi was having issues early in the week but looks to operating at normal levels now. Meanwhile, Sabine Pass deliveries have been ranging between 4.2-5 Bcf/d, and Calcasieu Pass LNG has been steadily receiving between 0.6-0.7 Bcf/d. These are positive signs that both new trains are operational.
The net balance was 2.9 Bcf looser week-on-week.
This email, any information contained herein and any files transmitted with it (collectively, the Material) are the sole property of OTC Global Holdings LP and its affiliates (OTCGH); are confidential, may be legally privileged and are intended solely for the use of the individual or entity to whom they are addressed. Unauthorized disclosure, copying or distribution of the Material, is strictly prohibited and the recipient shall not redistribute the Material in any form to a third party. Please notify the sender immediately by email if you have received this email by mistake, delete this email from your system and destroy any hard copies. OTCGH waives no privilege or confidentiality due to any mistaken transmission of this email.