This week, we look at the Monthly Electric Generator Inventory EIA 860m dataset which monitors the current status of existing and proposed generating units at electric power plants. This monthly dataset (last published in Dec 2021) gives a good glimpse of the current US power stack, and how it might evolve in the future. The changing power stack has a direct influence on natgas markets as the level of power burns changes drastically based on the type of generation added and retired over time.
Let’s first start by looking at the expected changes with incoming renewables and coal retirements. The next 5 years are transformational with wind and solar being developed at a rapid pace, while coal is further retired. The chart below shows the capacity change from each generation type summer on summer starting from summer 2021.
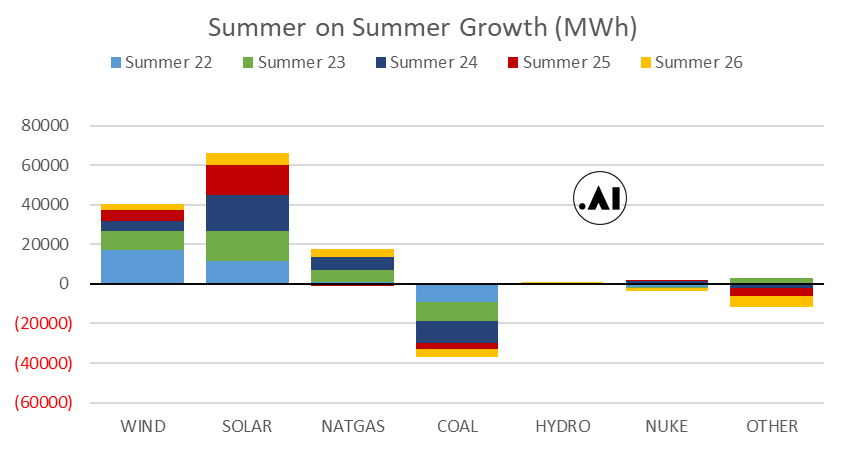
As can be seen, there is a total of 40GW of wind to be added between Summer 2021 and Summer 2025, and 66GW of solar over the same timeframe. The difficult part of renewables is their reliability. The typical utilization of both assets is not entirely predictable as both have daily variations and annual seasonality. These daily renewable variability changes have a direct influence on natgas power burns. This issue only gets more problematic as more wind and solar enter the power stack.
Nat gas will remain the dominant generation source even with the addition of renewables. Here is how the capacity picture will look:
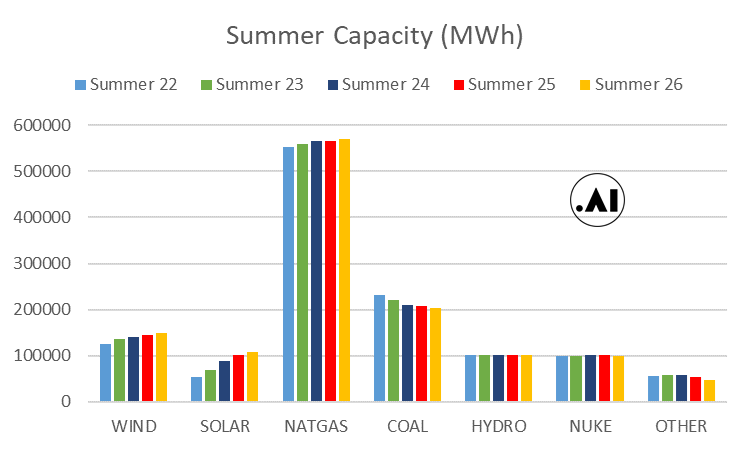
[remember that the capacity factor of renewables is much lower than fossil fuel generation; hence even with the addition it is still a small piece of the over all stack. The fortunate part is that it sits right at the bottom of the power stack.]
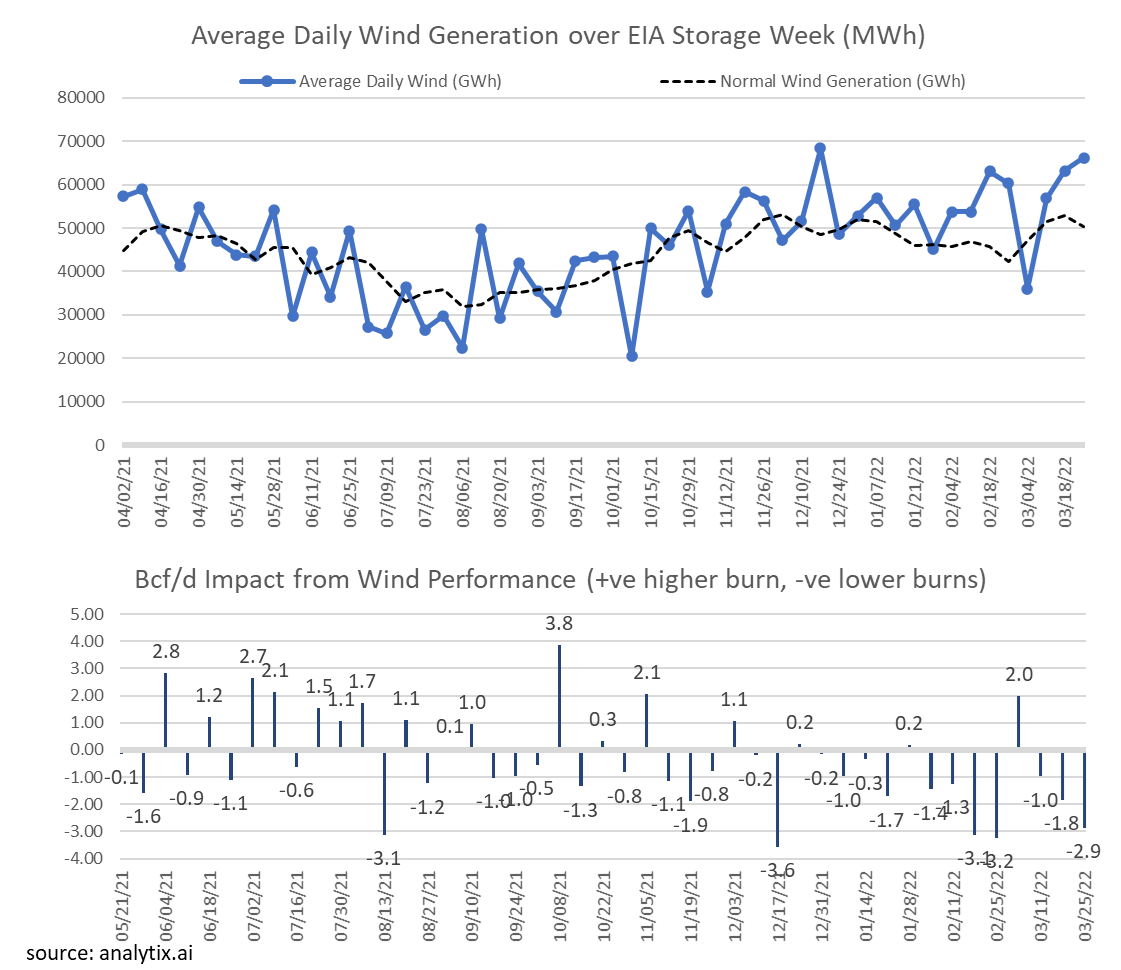
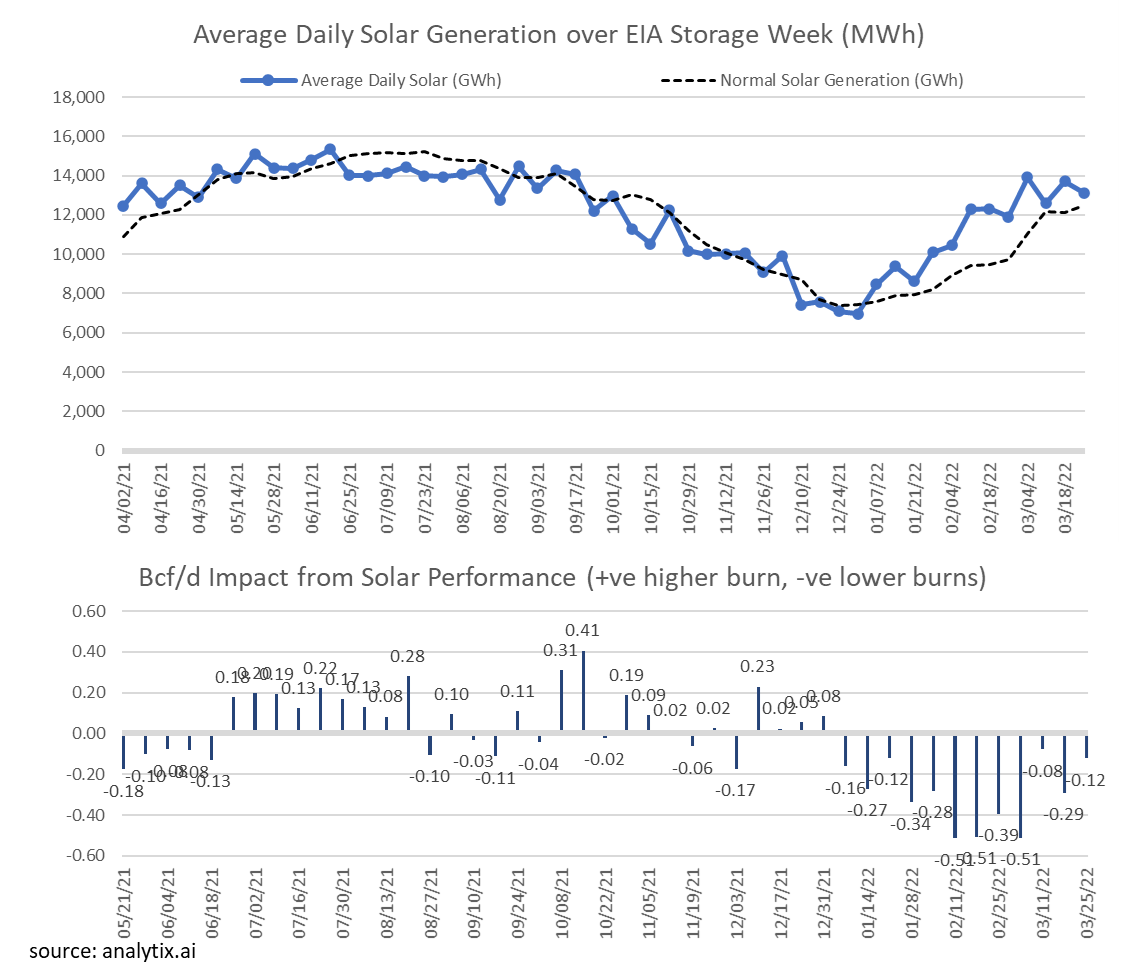
During summer 2021, the variability of renewables made a big impact on gas consumption, the weekly storage report, and ultimately expected end-of-season storage levels. To get a good understanding of how wind and solar are performing daily, we first calculated the “expected” utilization of both asset types to get the baseline. The next two chart packages show the weekly wind and solar performance versus our “expected” level and the potential impact on gas burns. As seen weekly performance bounces around a seasonal capacity factor pattern [wind (24-42%) peaks in the winter and dips in the summer and solar (12-29%) the opposite]. The bottom chart in each package calculates the weekly natgas power burn impact based on the over or underperformance of each asset.
For the summer, both wind and solar on average performed very close to the “expected” level but there were periods where wind and solar stayed above or below normal for some time. A good example is the month of July when both wind and solar underperformed leading to 1.2 Bcf/d of more burns on average. This additional gas burns, along with the low coal and hydro generation painted a very tight (bullish) picture.
We have similar charts for hydro and nuclear generation. Drop me a line (email: het@analytix.ai) and I’ll send them over. Hydro is especially interesting due to the low hydro conditions last year.
So now we get to what this means for this coming summer relative to last summer if we get normal wind and solar levels. We used the EIA 860m report to understand the amount of renewable capacity added (i.e the new available capacity) and the apply our monthly “expected” capacity factor for both to get a forecast for this coming summer. We then compared that to last year’s actual wind + solar generation to our forecast to get an idea of the YoY change by month. The last step is we assume a 7.5 HR gas plant is either activated or displaced based on the renewable capacity change.
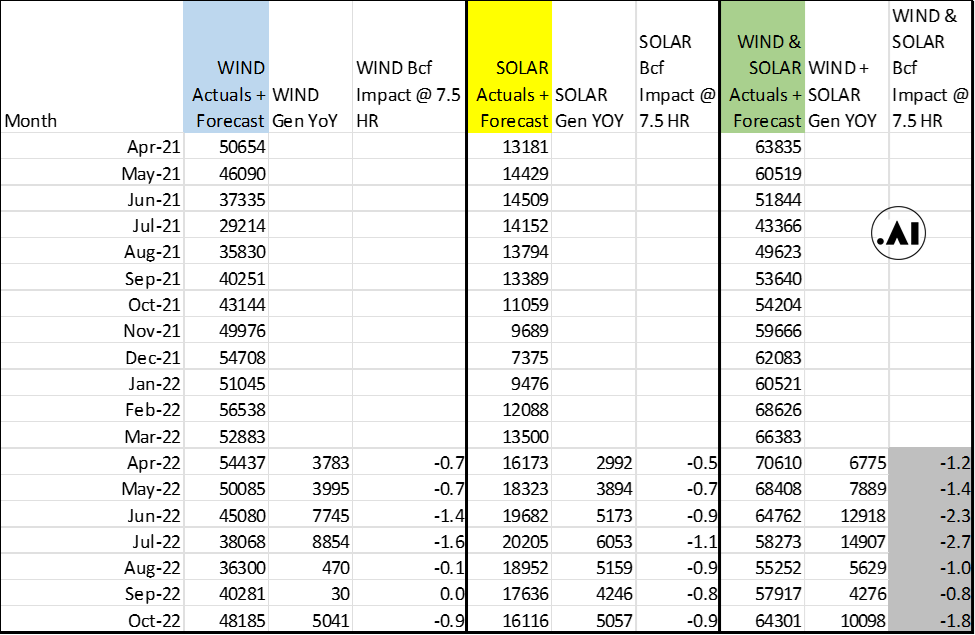
The net impact is a gas burns lower by an average of 1.6 Bcf/d through the summer or 400 Bcf lower. Just to reiterate, this is purely the impact of gas burns due to the growth of renewables. We still need to include the impacts from the coal prices/availability and hydro levels.
Fundamentals for the week ending Mar 25:
The EIA reported a -51 Bcf withdrawal for the week ending Mar 18th, which came much lower than market estimates. Storage levels were reported to be 1389 Bcf.
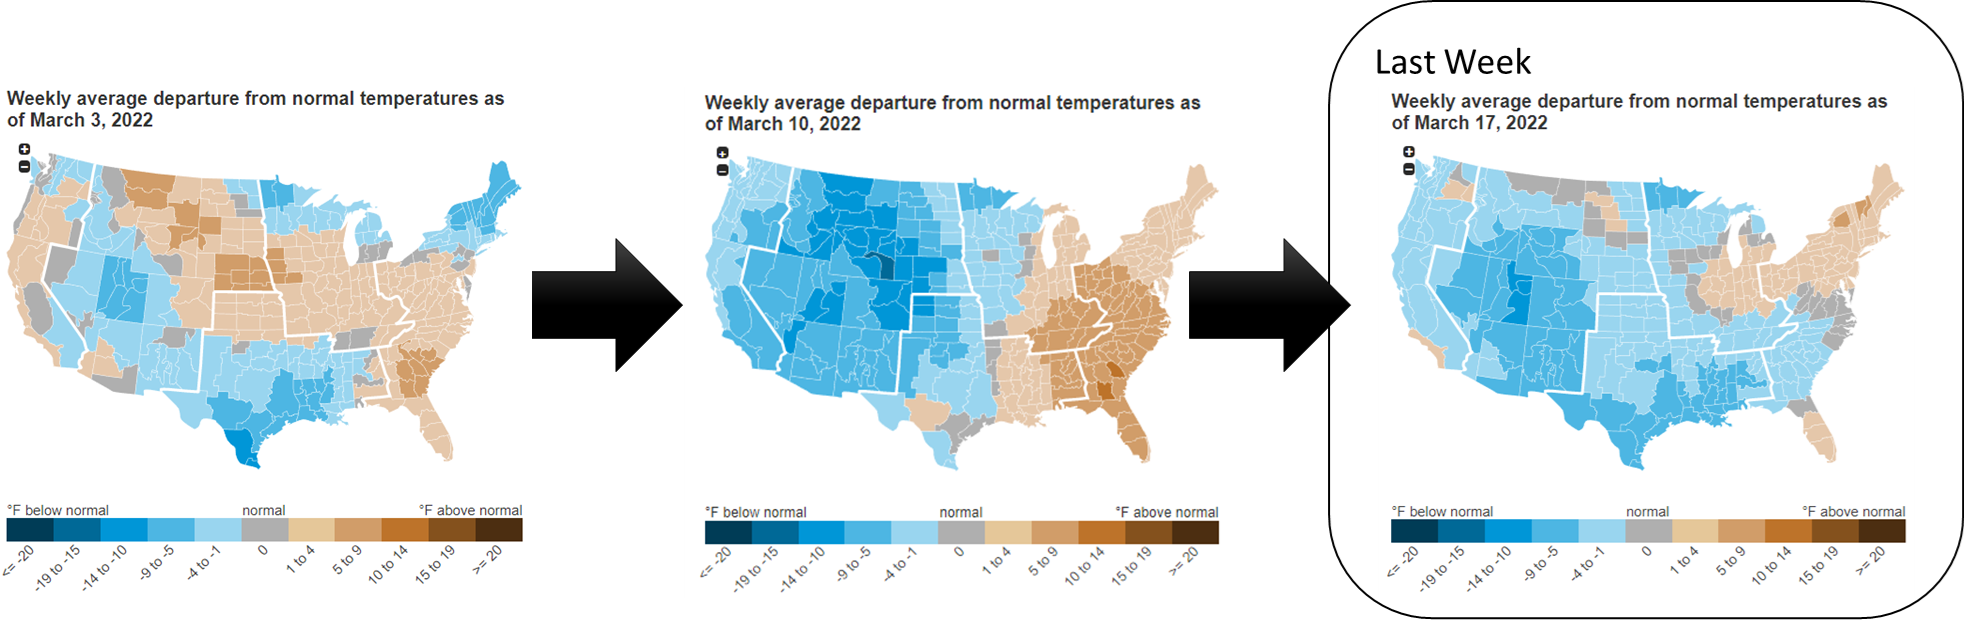
For the reported week, total consumption dropped with seasonal warming temps (even though temps were cooler than normal for most the country) and rising wind. The net result was L48 GWHDD dropping by -1.2F relative to the previous week; resulting in a 3.1 Bcf/d drop in natural gas consumption.
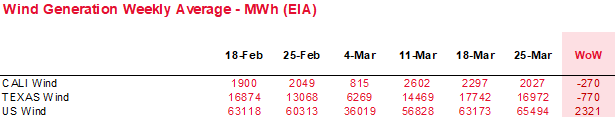
Adding to the week-on-week bearish sentiment was the big change in wind generation for the storage week. Wind generation rose to 63 GWh during the week from 57 GWh the week prior. We calculate ~52 GWh to be the expected norm for this time of the year.
This past week’s report was tight but not as tight as the last few reports. We estimate this report was ~3.2 Bcf/d tight vs LY (wx adjusted). This embeds the high wind experienced last week. With wind at normal levels, this report would have been closer to 5.0 Bcf/d tighter vs LY (wx adjusted).
For the week ending Mar 25th, our early view is +22 Bcf. This reporting period will take L48 storage level to 1,411 Bcf (-351 vs LY, -248 vs. 5Yr)
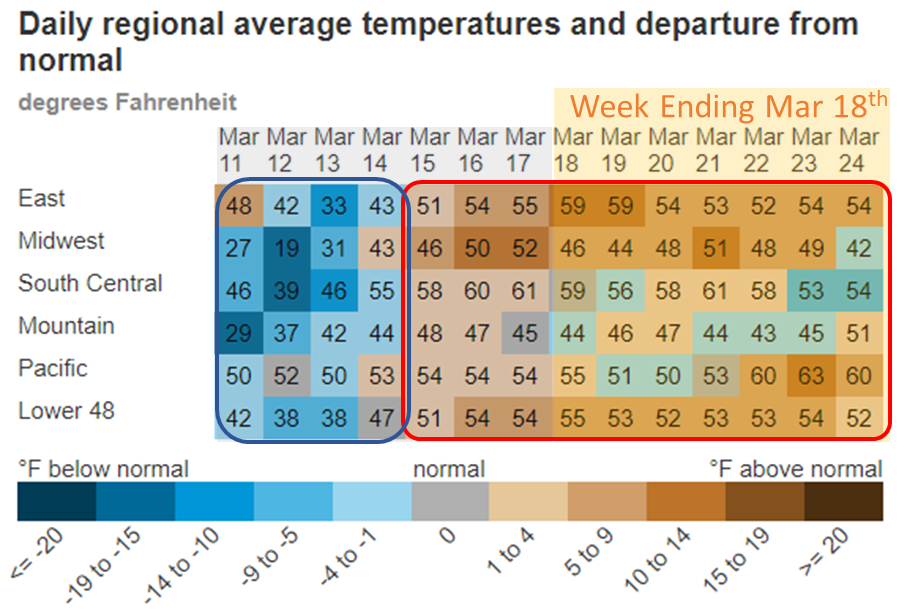
This report is expected to be an injection as total consumption continues to drop with warming weather and once again rising wind. Temps across the country were consistently warm to hot levels. The net change was L48 GWHDD dropping by -6.1F relative to the previous week; resulting in an 8.1 Bcf/d drop in natural gas consumption for space heating (rescomm only). In some parts of the country, it was hot enough to crank up the AC. Even Calgary hit 65F on Wednesday.
The warming temps (leading a seasonal decline in power loads) and rising wind generation once again pushed power burns lower. The wind generation grew week-on-week by 2.3 GWh on average. If a 7.5 HR natural gas generator was perfectly offset by the increased wind, then we would expect to see a 0.4 Bcf/d drop in power burns.
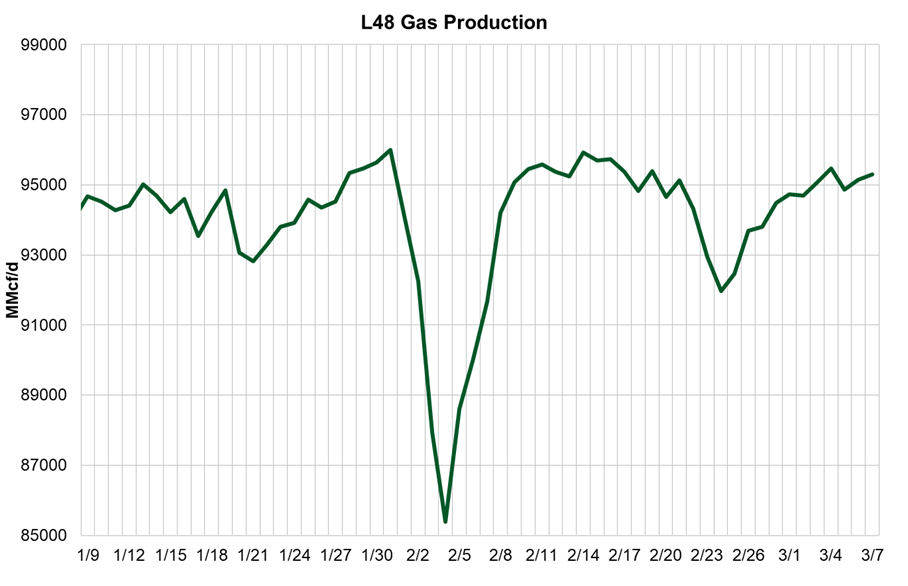
Domestic dry gas production also grew with the South Central production returning. Total production was higher by 1.2 Bcf/d to an average of 95.3 Bcf/d. Production from TX continues to recover, and more specifically from West Texas freeze-offs the week prior and the rumored outage (fire) at the Aethon processing plant that caused the drop in production on March 1st from the Haynesville basin. Since last weekend we have seen volumes from the Aethon processing plant area recover as volumes have started to shift to other pipes. According to Criterion Research, “Gulf South pipeline nominations nearly returned to normal … reaching 2.8 Bcf/d as the pipe redirected gas supply onto other meters as the Hall Summit station remains offline…. The Hall Summit meter that grabs gas from an Aethon subsidiary remained at zero, but the Aethon United Desoto station started flowing more (as did others)”. Here is a look at dry gas production levels as we exit winter.
Finally we look at LNG where total deliveries averaged 13.0 Bcf/d, which was 0.1 Bcf/d higher than the previous week. Early in the week (Mar 19th), LNG deliveries hit a new high of 13.75 Bcf/d. That didn’t last long with Freeport was having issues midweek and dropping to half its regular volume for a few days.
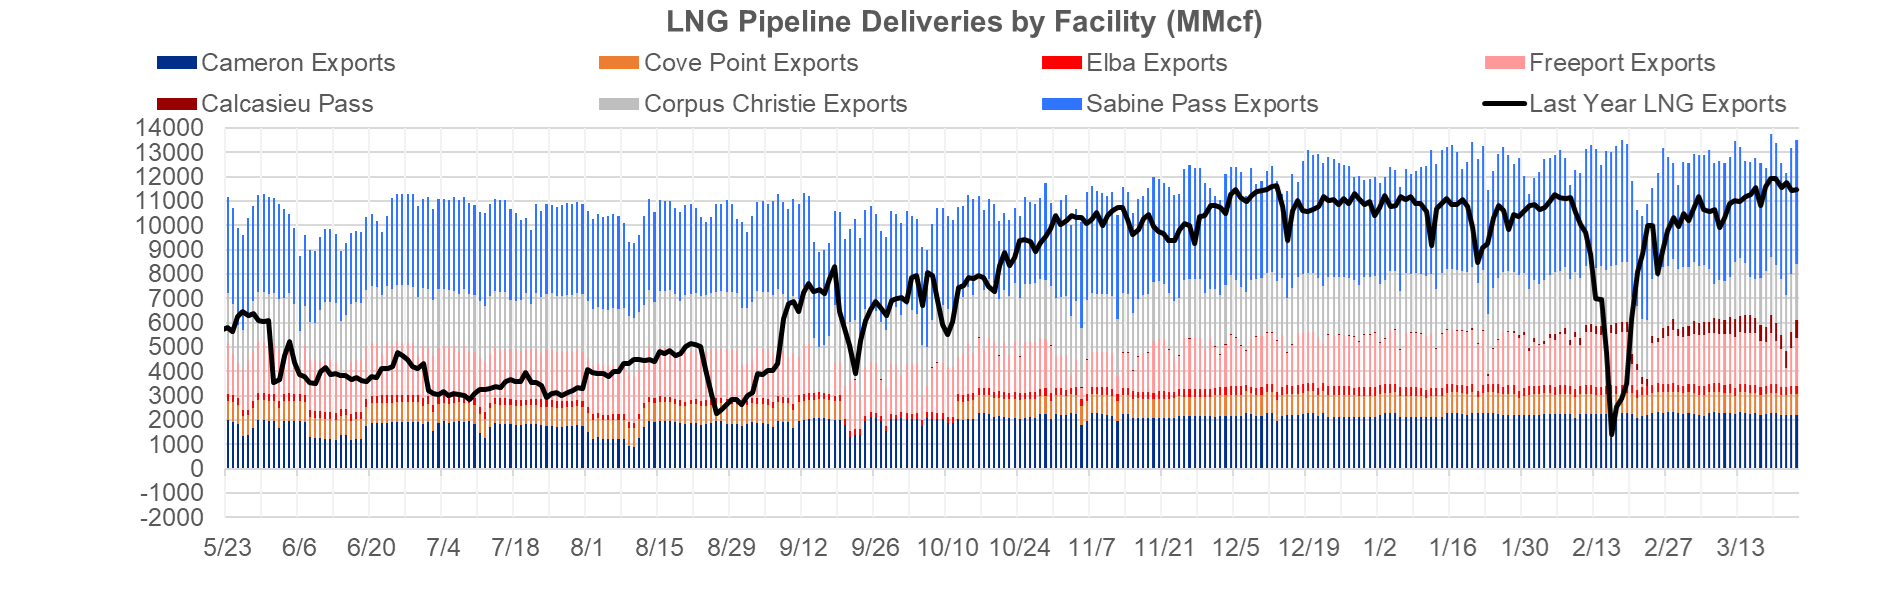
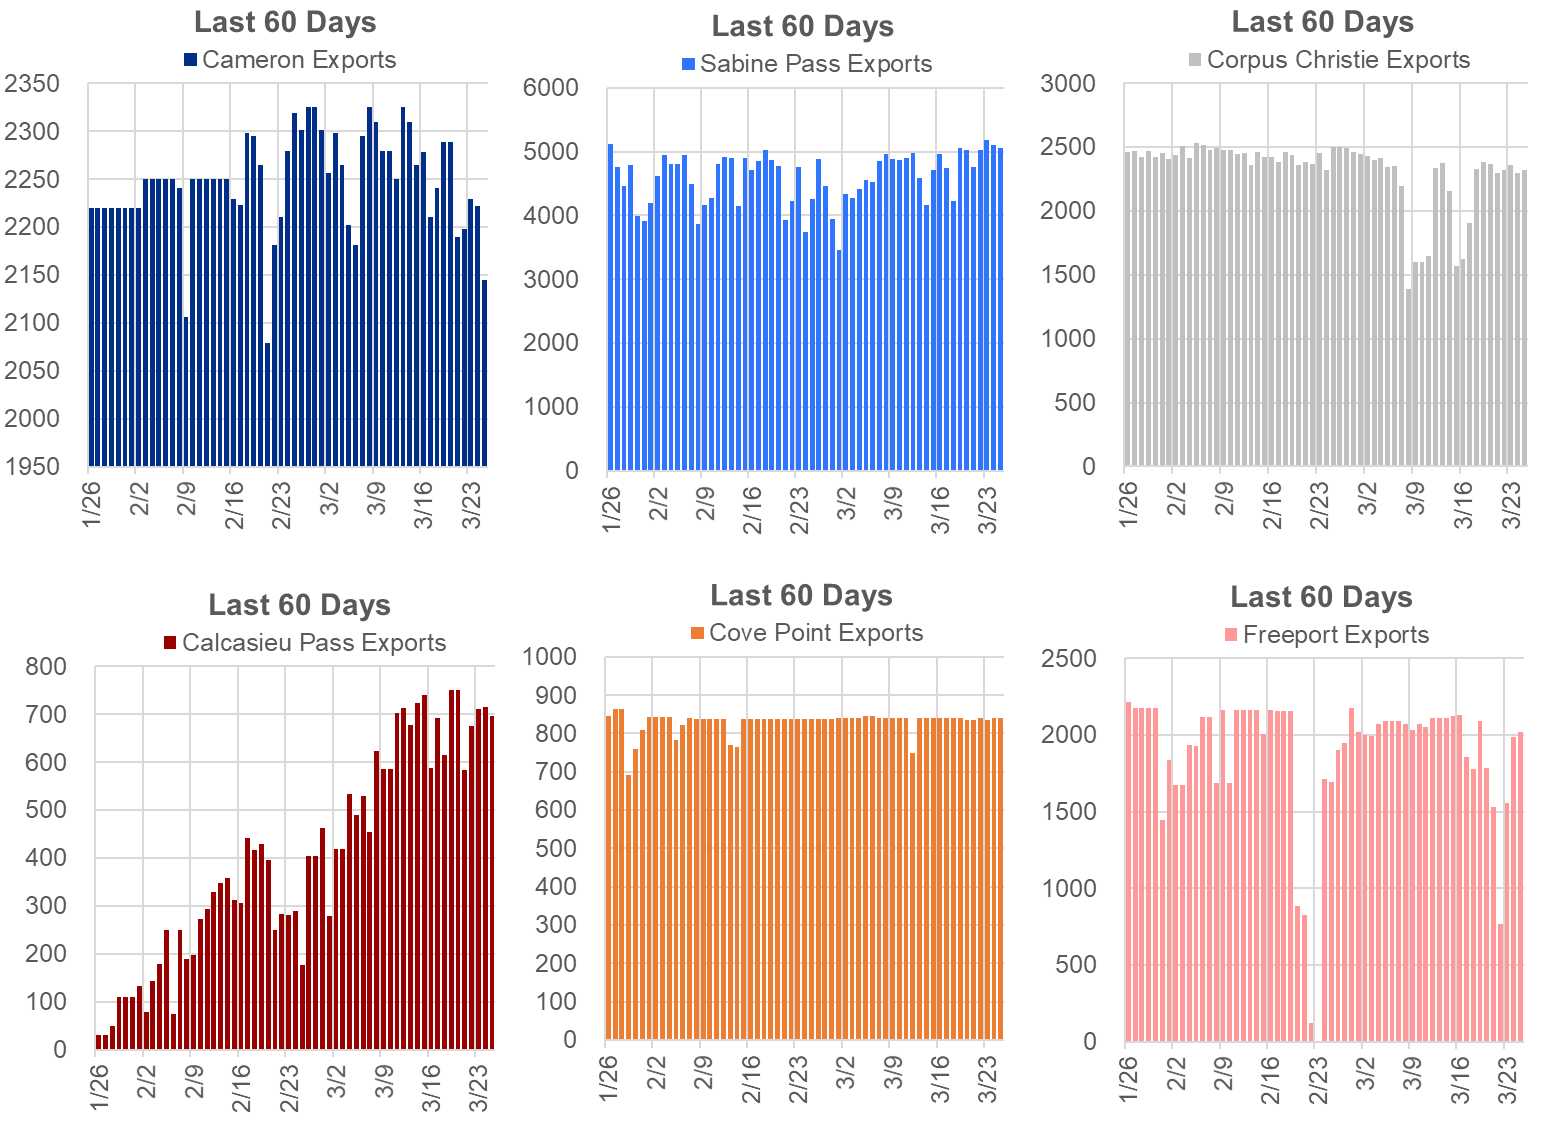
Here is the facility level view:
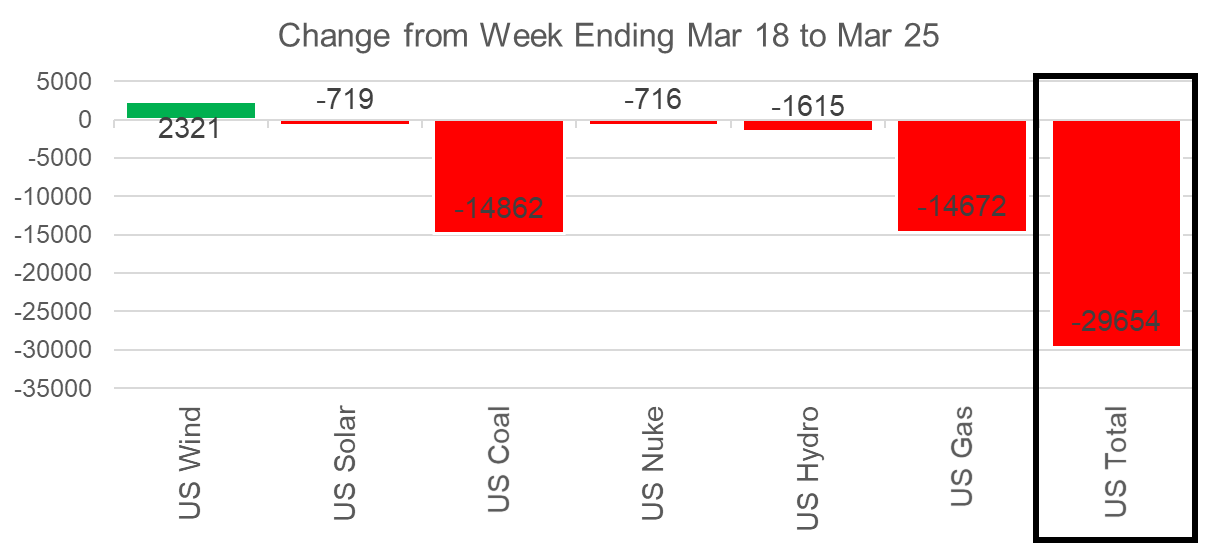
The net balance was 11.0 Bcf/d looser week-on-week.
This email, any information contained herein and any files transmitted with it (collectively, the Material) are the sole property of OTC Global Holdings LP and its affiliates (OTCGH); are confidential, may be legally privileged and are intended solely for the use of the individual or entity to whom they are addressed. Unauthorized disclosure, copying or distribution of the Material, is strictly prohibited and the recipient shall not redistribute the Material in any form to a third party. Please notify the sender immediately by email if you have received this email by mistake, delete this email from your system and destroy any hard copies. OTCGH waives no privilege or confidentiality due to any mistaken transmission of this email.