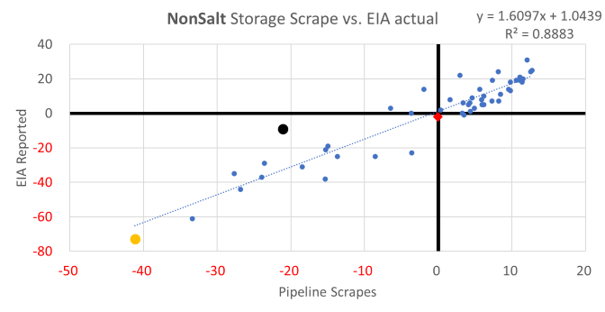
Let’s start this week by reviewing this week’s storage number. The -52 Bcf was in line with market expectations and it fits quite well with the output of the scrape models. Unlike last week, the South Central storage activity made a lot more sense.
RED Diamond = Week Ending Mar 05th (Last week)
BLACK Dot = Week Ending Feb 26th
Yellow Dot = Week Ending Feb 19th
[Note: the same graphics for all the other regions are a couple of pages down]
It’s pretty clear that RED Diamonds do fit this week
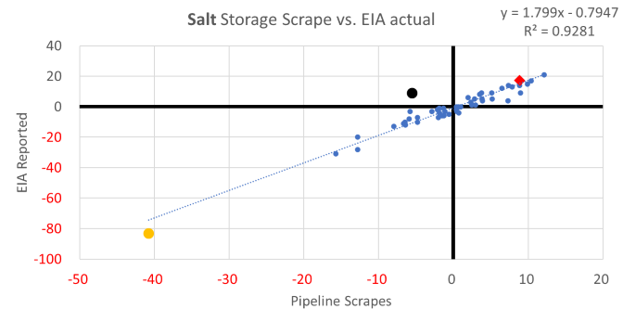
After having this number reported to us, we should feel more confident with upcoming reports.
For the remainder of the report, let’s focus on LNG.
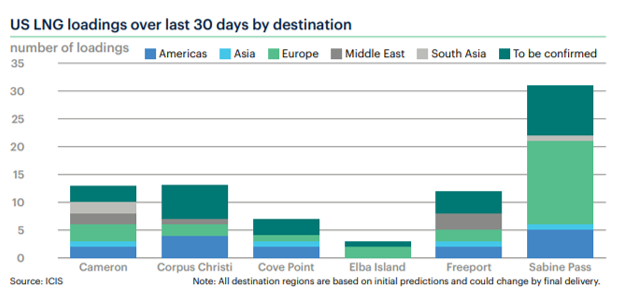
LNG levels have rebounded back after the pullback in February. In January, we saw massive spot price premiums in Asia that seemed to pull as many US cargos as possible. Now we see a restart in the US-EU LNG trade as margins have tightened and transport costs become more of an important factor.
The graph from ICIS’s LNG Edge platform shows where US LNG loading has been heading. As seen, a vast majority has been heading to Europe.
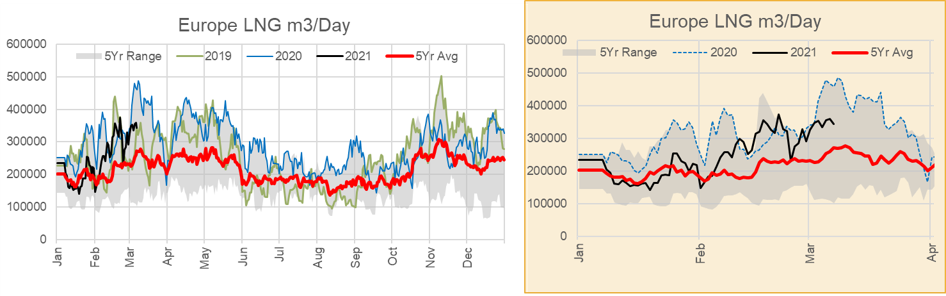
Here is how the Europe LNG imports look compared to past years.
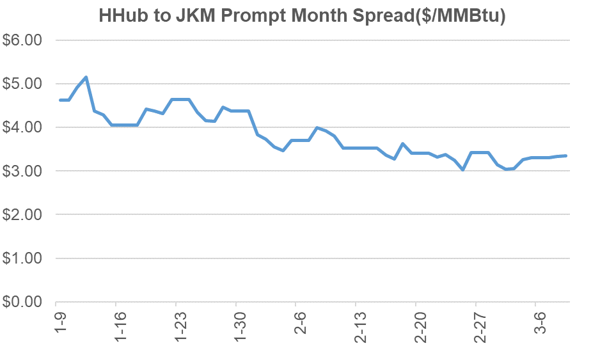
Here is the latest look at global natgas spreads. As prices contract, so do the interregional spreads.
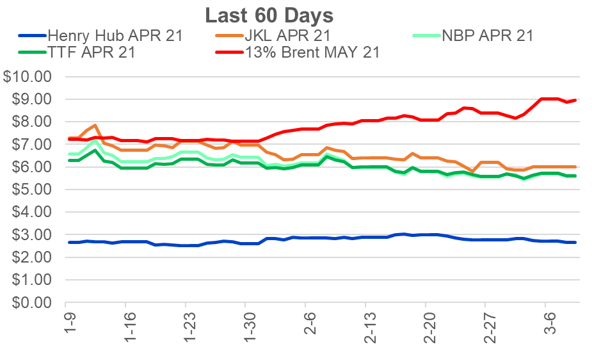
More specifically, the US to Asia spreads. It has wound down which makes sense with winter rolling off in the northern hemisphere.
With Europe being much closer, it just makes the nearer journeys much more attractive. Thankfully, Europe needs US LNG even after starting strong storage levels at the beginning of winter. While recent temperatures have been fairly mild, we saw a cold winter through December and January, and that combined with the lockdowns has helped deplete European storage levels.
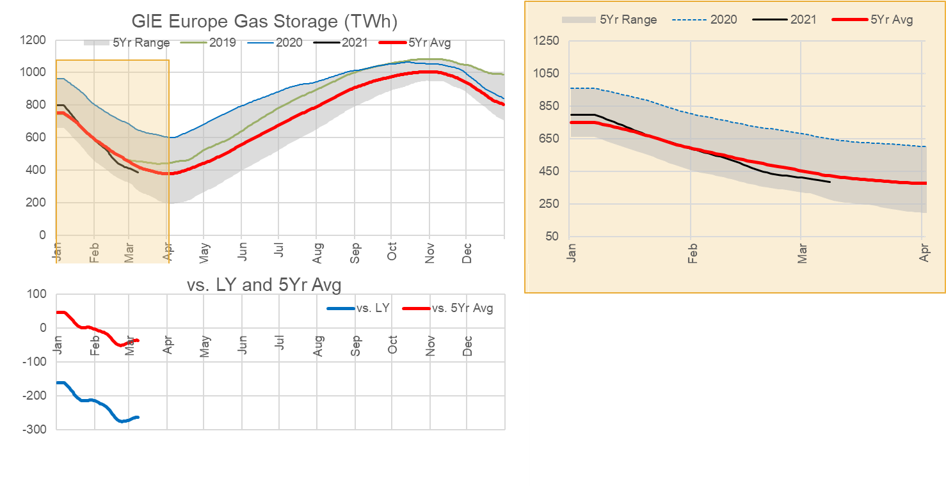
Storage levels across the continent are down 24% year-on-year to 34% capacity. This should at least support US LNG exports through the early summer period.
Latin America is another notable destination for US LNG. According to ICIS, Mexico’s state buyer CFE saw US pipeline supply disruption due to the cold weather in February. This forced CFE to purchase 4 cargoes for arrival between late February and early March. Those distressed cargoes were believed to be priced around the $8.50/MMBtu.
Argentina also launched its annual spot tender for LNG cargoes. The country is looking to buy 24 cargoes for its Escobar terminal through the May-August period. The country’s domestic production can meet its needs through the summer period, but as it gets colder in Argentina and heating demand goes up, LNG is required to balance their system.
Brazil has also relied heavily on US supplies in the past, especially during low hydro years. This year the country is experiencing low hydro levels, and hence the expectation is for Brazil to be a destination for US LNG. Brazil also commissioned two new LNG terminals over the second half of 2020 that will be looking for volumes.
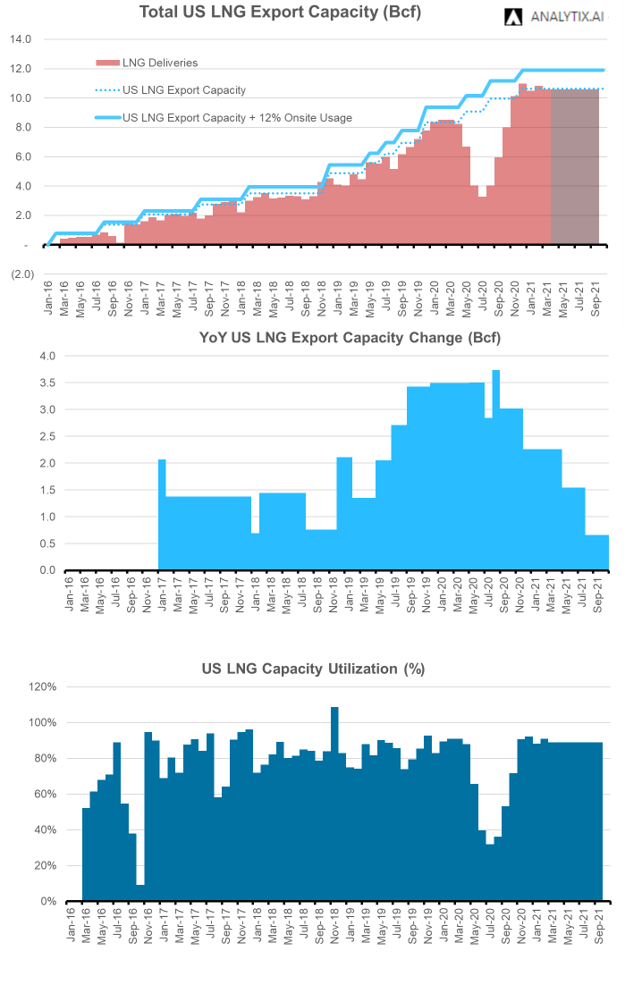
We expect that US LNG feedgas levels will be 10.6 Bcf/d or 85% capacity utilization over summer 2021. The LNG economics suggest the US will flow at strong levels, and prior to summer 2020, the utilization during the summer averaged between 81-84%. We used 85% to account for the strong pull from Europe this coming summer.
Fundamentals for the week ending Mar 12: This past week’s storage report was a lot more manageable. It came within the expected range and between the outputs of our S/D and flow model.
For the week ending Mar 12, our early view is a mere -9 Bcf draw. The largest factor in the low draw this week is a large amount of industrial and oil refinery consumption still being offline.
Here is the pipeline data showing the deep drop in industrial consumption after the Feb cold. There is an element of rising temps that should be factored in to this view.
After the severe freeze-off domestic production has come back and stayed steady. As we reported last week, we saw a burst of production (above pre-cold levels) from the TX/NM and the Midcon region. The levels seem to be holding up. Production from the Northeast was lower midweek with reported maintenance on TETCO and TCO. L48 production dropped slightly from 92.5 to 92.3 Bcf/d week on week.
We recorded L48 GWHDD decreasing once again by an average of -3.2 to 17.0. With the warmer temps, total gas consumption decreased accordingly by an average of 7.4 Bcf/d to 81.7 Bcf/d. For this past week, power was lower by 1.4 Bcf/d as we get to the shoulder season. RC and Industrial were both the lower as well. RC was lower by 4.9 Bcf/d WoW, while Industrial was lower by 0.8 Bcf/d.
Deliveries to LNG facilities averaged 10.6 Bcf/d, which was +0.5 Bcf/d higher than the previous week. The increase came from Cameron and Sabine resuming normal operational levels.
Net the balance was looser by 6.1 Bcf/d week-on-week.
Expiration and rolls: UNG ETF roll starts on Mar 15th and ends on Mar 18th.
Apr futures expire on Mar 29th, and Mar options expire on Mar 26th.
This email, any information contained herein and any files transmitted with it (collectively, the Material) are the sole property of OTC Global Holdings LP and its affiliates (OTCGH); are confidential, may be legally privileged and are intended solely for the use of the individual or entity to whom they are addressed. Unauthorized disclosure, copying or distribution of the Material, is strictly prohibited and the recipient shall not redistribute the Material in any form to a third party. Please notify the sender immediately by email if you have received this email by mistake, delete this email from your system and destroy any hard copies. OTCGH waives no privilege or confidentiality due to any mistaken transmission of this email.