Coal to gas switching has been one of the largest flexible features of the gas market, i.e. natural gas prices adjusting to change a region’s power stack to either bring on more gas generation or turn it off. Other than storage activity, this is the only key lever used to keep the gas markets balanced (almost instantaneously).
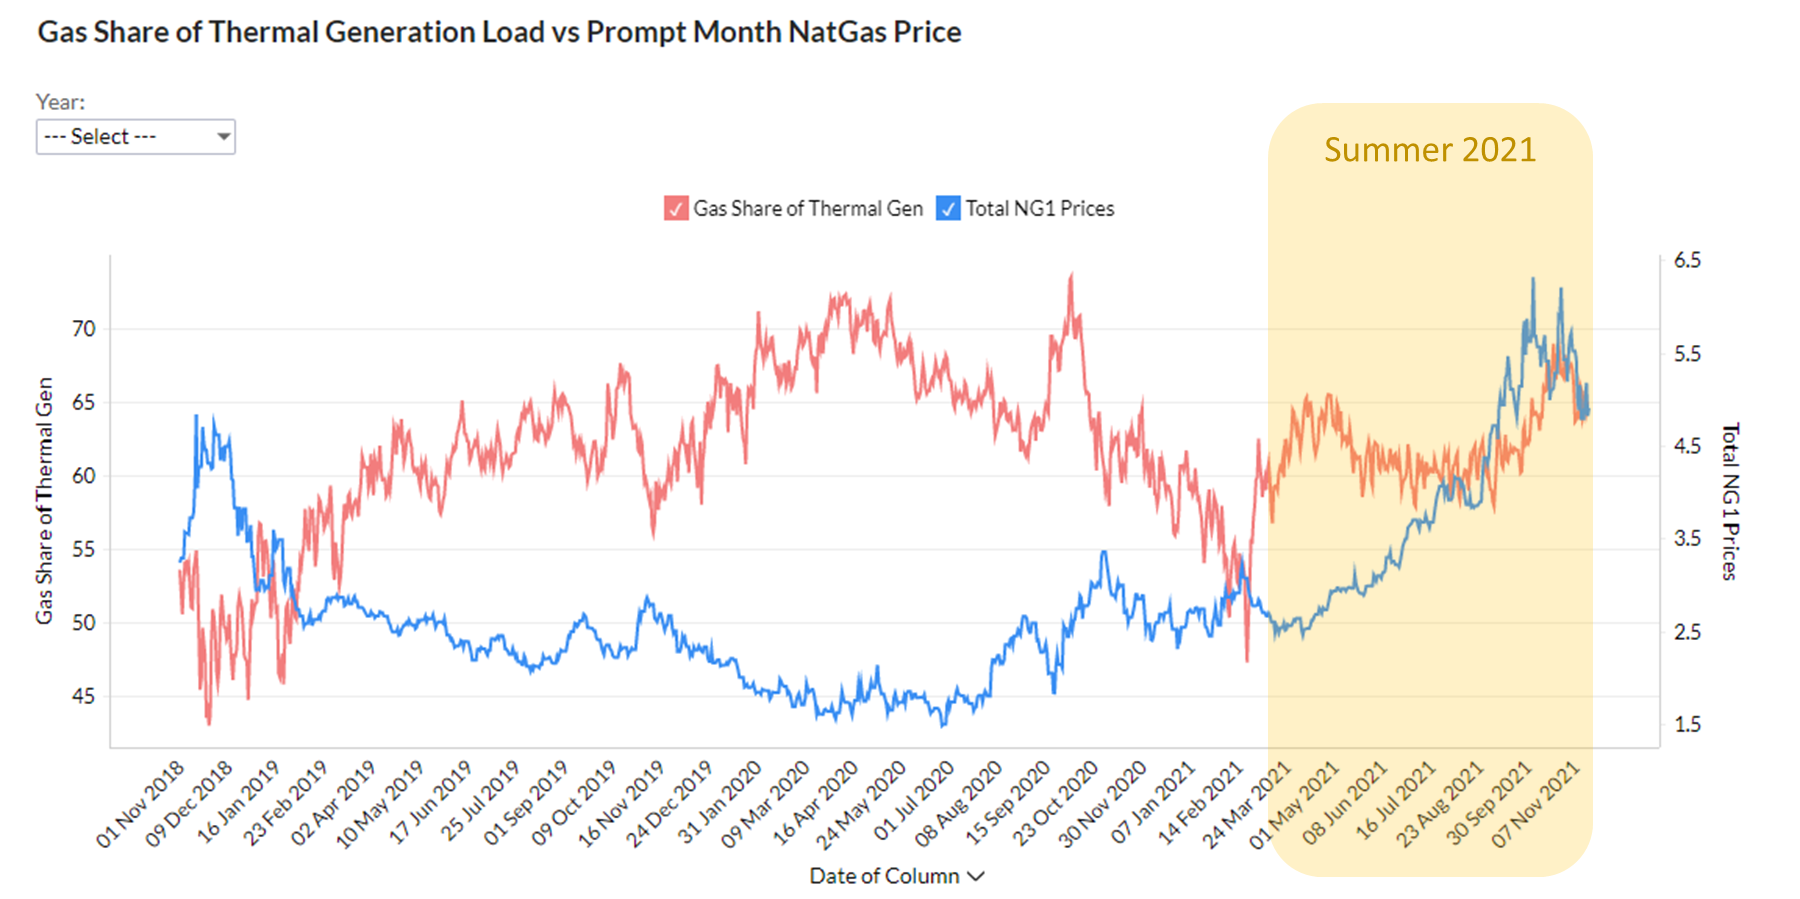
This relationship is now broken. The following chart shows the coal-to-gas switching dynamic we observed over the past few years and you can see it falling apart this past summer.
Click here to see the interactive chart
Why did the power market not respond in the same way this summer? Here are the few reasons we have been pointing to:
- Coal retirements – over 13 GWs retired since April 2020 and therefore coal gen is just not there in some instances.
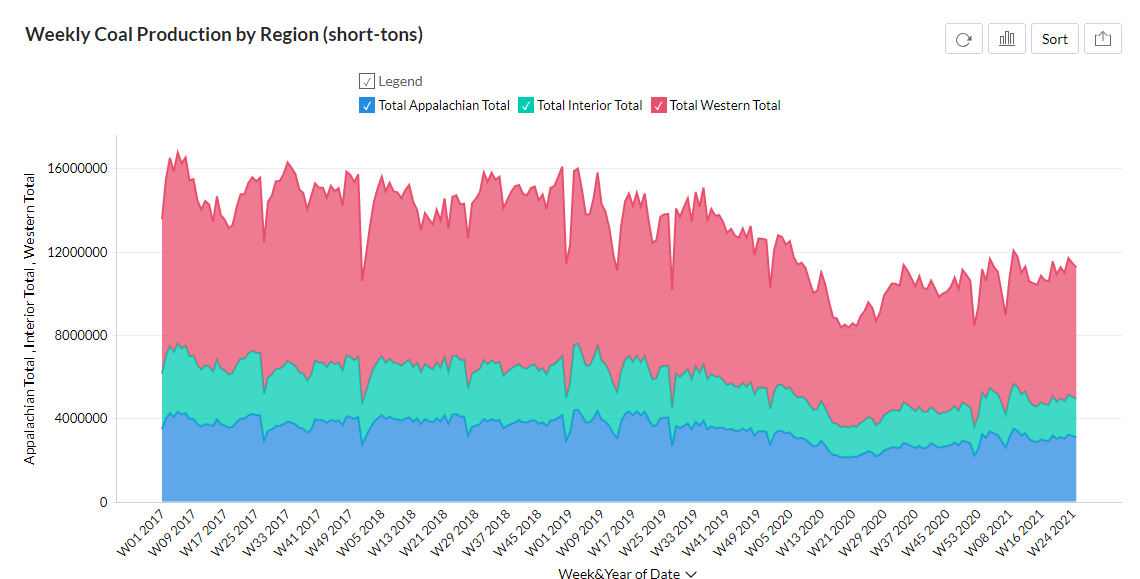
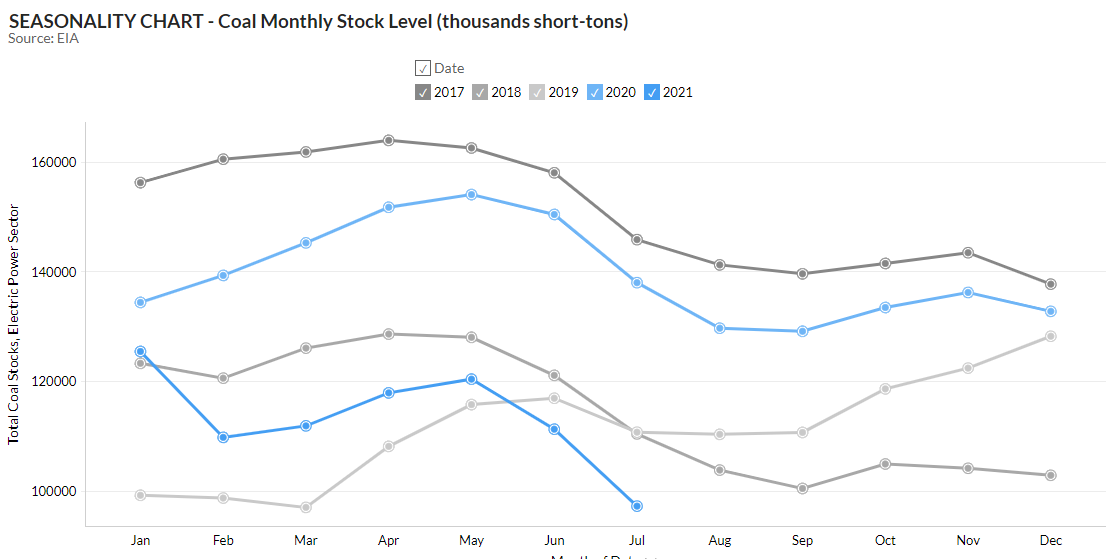
- Lower coal production and stocks – mines have been reducing production for years, and COVID shutdowns just accelerate some of these closures. Now with returning demand, the mines can not respond as fast.
Click here to see the interactive chart
Click here to see the interactive chart
- Increased coal exports – strong international prices are drawing away excess US coal. Exports make up ~15% of the total supply.
- Renewables growth – gas gen has quick ramp times to moderate the wild variability of wind.
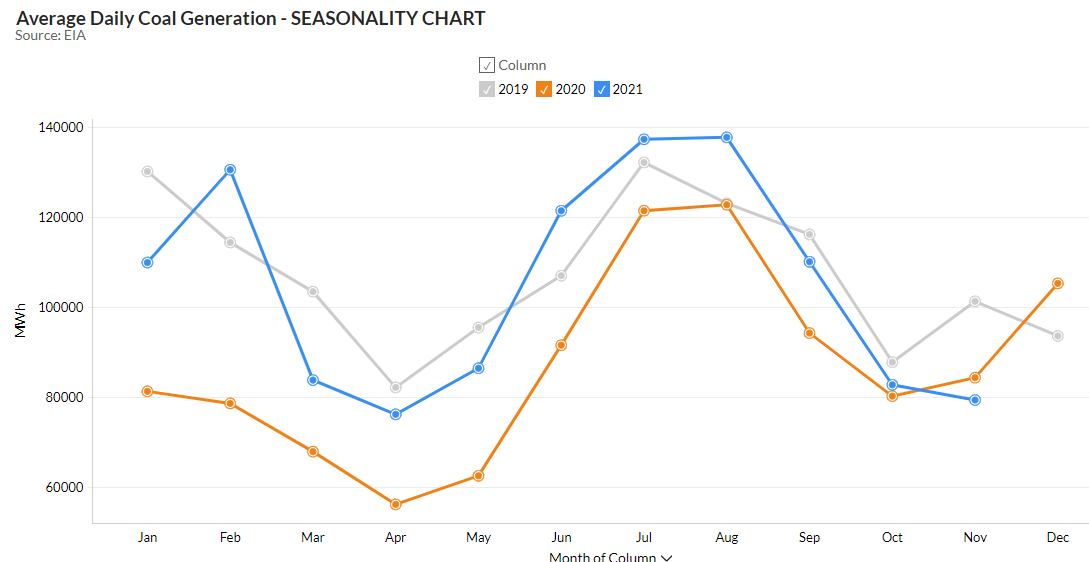
With all those facts we still saw coal generation increase. The surge in post-COVID electricity demand and lower year-on-year renewables output needed the coal generators to participate. Summer-on-summer we see that total power demand was up by 4%, but coal generation was higher by 19% and natural gas generation was up by 29%.
Click here to see the interactive chart
With the start of winter season, coal generation has dropped off significantly this month. Many utilities burned through their stockpiles over the summer and it’s difficult to buy more. Most coal is contracted on a long-term basis with very little changing hands in the spot market; hence price can move quite quickly if utilities are out trying to purchase it. The following chart shows a big step up in coal prices in the last few weeks as buyers try to procure extra supplies.
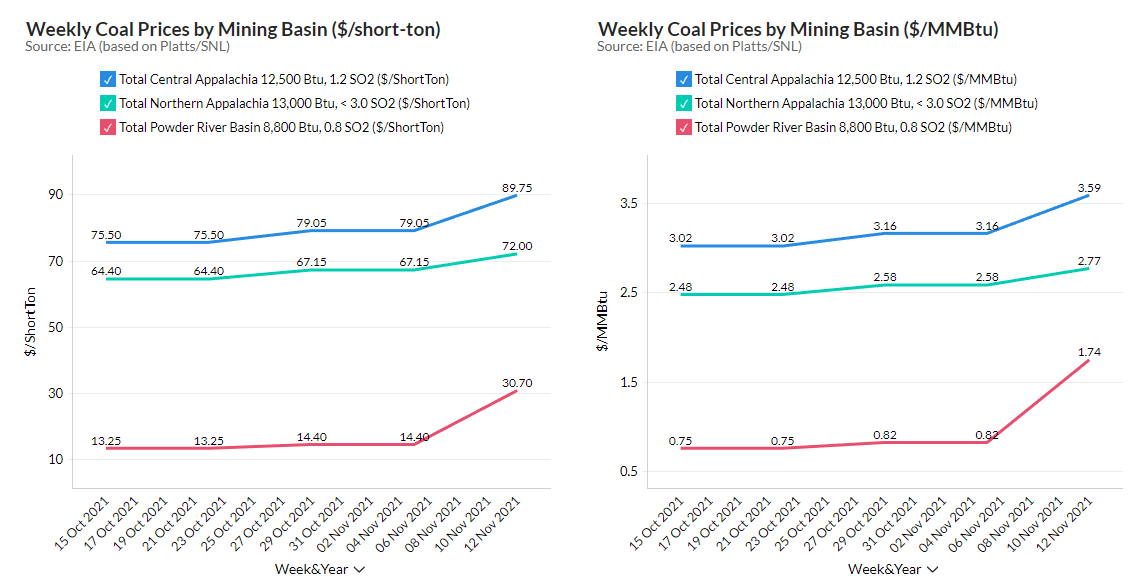
Click here to see the interactive chart
The consensus is that the lower coal gen this month is a result of holding back on supplies for the peak winter months. This month so far coal generation is lower by 9% year-on-year. As a result, natural gas burns have been extremely strong or 12% higher than last year despite prices being 175% higher (prompt month averaging $5.19 vs. $2.96).
We will keep a close eye on power burns this winter as the combination of renewable, higher coal prices, and weather will likely result in volatile behavior.
Fundamentals for the week ending Nov 19:
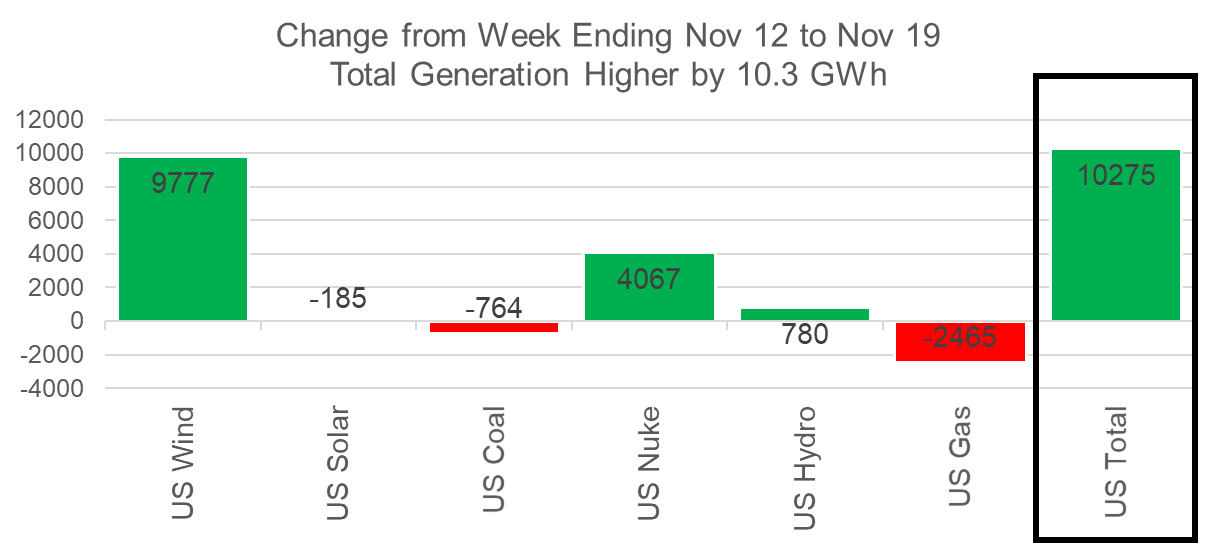
The EIA reported a +26 Bcf injection for week ending Nov 12th, which was close to the market consensus. The market had been anticipating a decent build due to a big drop in power burns from the previous week – wind averaged 51 GWh (+19 GWh WoW), and nukes averaged 88 GWh (+4 GWh WoW) after rapidly returning from maintenance/refueling.
Total storage reached 3,644 Bcf to close the summer season, despite all the drama we had over the past 6 months. Overall levels would have been even higher if PG&E did not reclassify the 51 Bcf of working gas to base gas. Even with PG&E reclassification, total storage injections totaled 1,867 Bcf over the summer which came in lower than the 5Yr average.
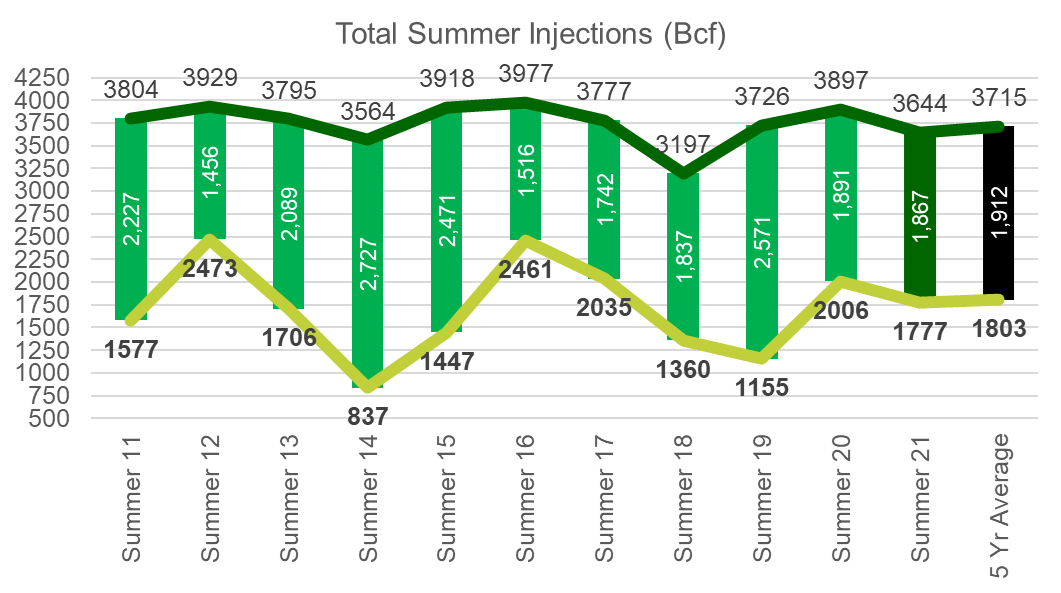
For the week ending Nov 19th, our early view is -22 Bcf. This reporting period will be the first draw of the season taking the L48 storage level to 3622 Bcf (-329 vs LY, -59 vs. 5Yr).
This past week we see total consumption once again jump higher even with the warmer-than-normal weather. Total HDDs increased by 2.5F WoW leading to both ResComm and Industrial demand growing by 6.1 Bcf/d. Total power load did increase by 10 GWh, but wind and nukes grew enough WoW to make up the rise. Wind was higher by an average of 9.7 GWh, and nuke was higher by an average of 4.1 GWh; hence power burns were flat week-on-week.
Domestic dry gas production was lower by 0.8 Bcf/d to 96.4 Bcf/d after three straight weeks of increases. The drop came from various regions and should be treated more as production noise.
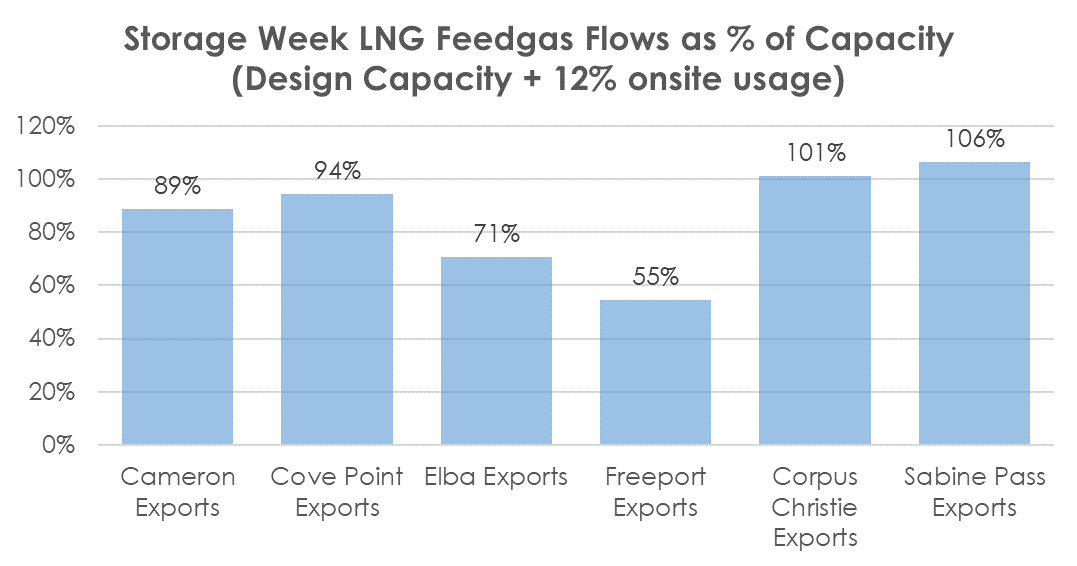
Deliveries to LNG facilities averaged 11.1 Bcf/d, which was -0.1 Bcf/d lower than last week. LNG deliveries looked to finish the week strong with Freeport nomination data on Thursday suggesting the maintenance on the pretreatment plant was complete, but later final nomination moved LNG feedgas levels to the facility back down to the 75-80% operational state. As of Friday, Freeport looks to be fully operational. Sabine continues to operate at strong levels, which suggests that train 6 is receiving volumes. Here is how all the terminals operated vs their design capacity.
The net balance was 6.9 Bcf tighter week-on-week.
Expiration and rolls: UNG ETF roll starts on Dec 15th and ends on Dec 20th.
Dec futures expire on Nov 28th, and Nov options expire on Nov 24th.
This email, any information contained herein and any files transmitted with it (collectively, the Material) are the sole property of OTC Global Holdings LP and its affiliates (OTCGH); are confidential, may be legally privileged and are intended solely for the use of the individual or entity to whom they are addressed. Unauthorized disclosure, copying or distribution of the Material, is strictly prohibited and the recipient shall not redistribute the Material in any form to a third party. Please notify the sender immediately by email if you have received this email by mistake, delete this email from your system and destroy any hard copies. OTCGH waives no privilege or confidentiality due to any mistaken transmission of this email.
