This week we look at how exports are becoming a major component of the US natural gas S/D, despite fluctuating demand due to weather. This includes both LNG and piped, but we will focus on Mexican exports today.
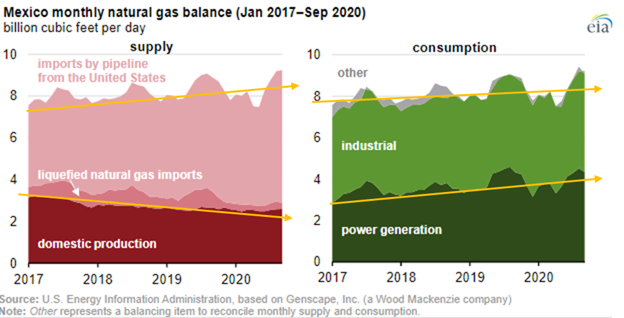
Since 2016, Mexico has been expanding its natural gas pipeline system resulting in a growth in imports from the US as domestic production slides with weak oil prices.
The industrial and electric power sectors accounted for all the natural gas consumption in Mexico in 2019, with industrial at 54% and electric power at 46% of the total. Natural gas use in both sectors declined earlier this year because of the measures taken to contain the spread of the COVID-19, but in August 2020, Mexico’s natural gas consumption started to recover and surpassed last year’s levels.
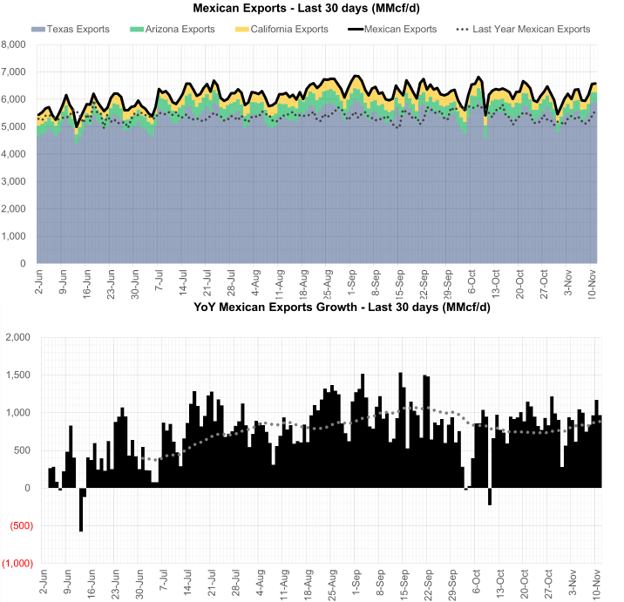
In November the piped export to Mexico averaged 6.17 Bcf/d, which is 0.89 Bcf/d higher than last year. The peak flow of 6.86 Bcf/d was recorded by Bloomberg on Sept 2nd.
The expectation for growth is expected to continue with the expanding Mexican natural gas system and more downstream demand coming online line next year.
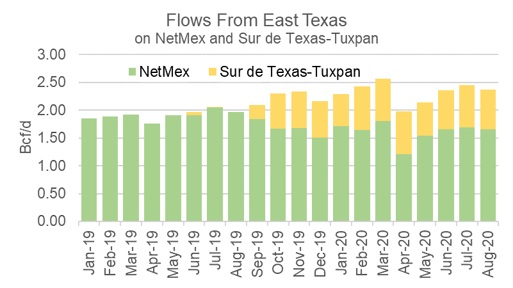
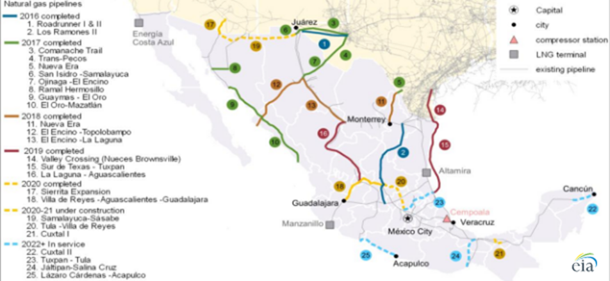
The latest pieces of infrastructure that have led to export growth have been the completion of the Sur de Texas-Tuxpan pipeline, and the Villa de Reyes-Aguascalientes-Guadalajara (VAG) pipeline [the southern-most segment of the Wahalajara system]. VAG is a 0.89 Bcf/d system that began operations in June 2020. CFEnergía recently noted that it has begun supplying fuel from Waha, Texas, to the steel company Arcelor Mittal (the largest industrial consumer in Mexico), as well as power plants that were once fueled with LNG. Below are the major export pipeline flows since 2019.
Flows out of East Texas have been on the rise since late-Q3 2019 with the start of Sur de Texas-Tuxpan. Coinciding with the start of Sur de Texas-Tuxpan, we can see that flow on NETMEX dropped as flow jumped onto the new underwater pipeline to get natural gas further downstream.
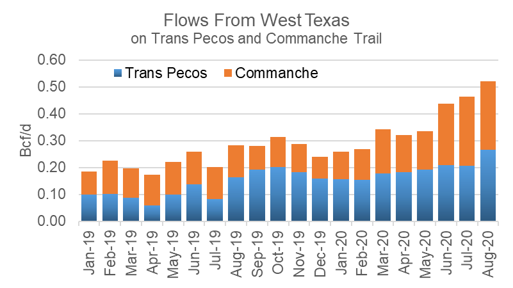
Flows out of West Texas have been on a rise since late Q2 2020 as more pipeline and powerplants come on in West Mexico. Some of these new flows make it to the Wahalajara network, which is likely to partially displace higher-cost liquefied natural gas (LNG) imports into Mexico’s Manzanillo terminal. Traditionally this LNG terminal has served markets in Guadalajara and Mexico City. Flows through Commanche Trail are expected to increase with the completion of the 0.47 Bcf/d Samalayuca-Sásabe pipeline in either late 2020 or early 2021.
Below is a map from the EIA that show the build-out of the pipeline infrastructure.
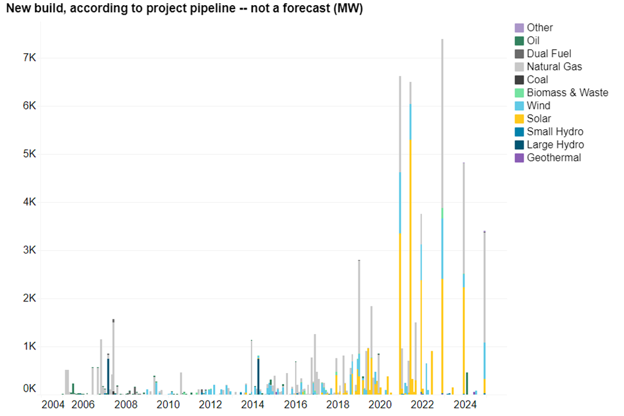
Proposed Mexican natural gas power plant projects can be found in the SENER INDICATIVE PROGRAM FOR INSTALLATION AND REMOVAL OF POWER STATIONS. The addition of new projects will coincide with more natural gas coming from the US as Mexico’s domestic production remains in decline.
BNEF produced this data in a great visual format.
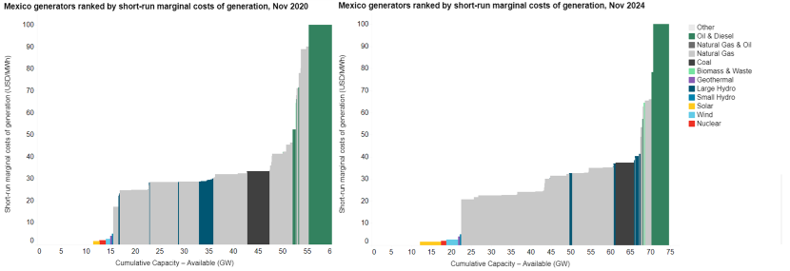
Here is how the current power stack looks vs 4 years out. With the build out of more efficient natural gas generation and renewables, we’ll see coal pushed out.
Another good source to keep up with the pipeline infrastructure in Mexico is straight from the Mexican Government.
Fundamentals for the week ending Nov 13: Our early view for the upcoming storage report is a +27 Bcf injection for the lower 48. This would take storage levels to 3954 Bcf. The industry estimates for this report range between +10 to +35 according to The Desk.
US natural gas dry production dropped week on week with domestic production averaging 89 Bcf/d for the week. The production drop mainly comes from the Northeast where weak pricing pushed producers to close in some production.
Despite dropping supply, the biggest moving part was the drop in Rescomm demand with warmer temperatures to the east of the Rockies. Rescomm usage was off by 6.3 Bcf/d for the week.
Canadian imports were once again lowered last week averaging 3.9 Bcf/d. Mexican exports averaged 6.3 Bcf/d.
Deliveries to LNG facilities averaged 10.4Bcf/d, up 0.1 Bcf/d week on week to reach a new weekly record. Current LNG economics for the winter suggest flows at these levels all winter.
Expiration and rolls: UNG ETF roll starts on Nov 11th and ends on Nov 16th.
Dec futures expire on Nov 26th, and Nov options expire on Nov 25th.
This email, any information contained herein and any files transmitted with it (collectively, the Material) are the sole property of OTC Global Holdings LP and its affiliates (OTCGH); are confidential, may be legally privileged and are intended solely for the use of the individual or entity to whom they are addressed. Unauthorized disclosure, copying or distribution of the Material, is strictly prohibited and the recipient shall not redistribute the Material in any form to a third party. Please notify the sender immediately by email if you have received this email by mistake, delete this email from your system and destroy any hard copies. OTCGH waives no privilege or confidentiality due to any mistaken transmission of this email.