Energy shortages in China, the United Kingdom, and Europe are causing significant disruptions. There were power cuts in Northern China which left millions without electricity and closed factories. As the country faces energy shortages, the government has instructed utilities to procure enough energy for the winter at any cost to ensure the economy does not struggle. In Europe, industrial customers are having a hard time keeping up as well and many are temporarily shutting operations. Even coal plants are not able to come to the rescue because of a major coal shortage (see full story).
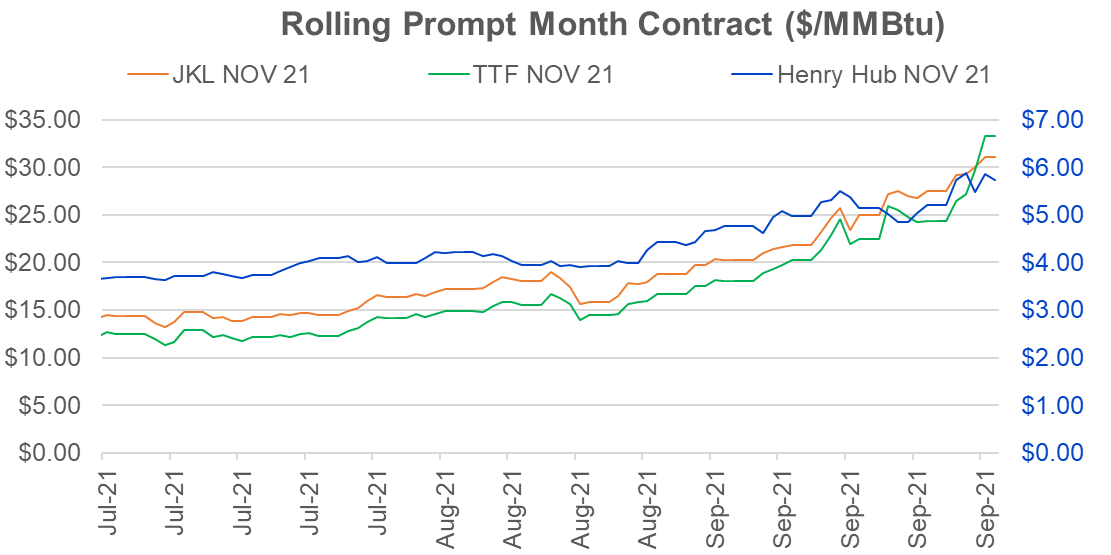
For the US, the price hike this past week did not match up with the fundamentals. The weather outlook starting last weekend moved more bearish all while production reached pre-Ida level – yet prices moved higher. Weather models pushed total expected Oct GWDDs much lower this week with levels falling near the levels seen in 2017. This comes with a confirmation of a La Nina episode sticking around.
Maxar Weather issued the following note on enelyst:
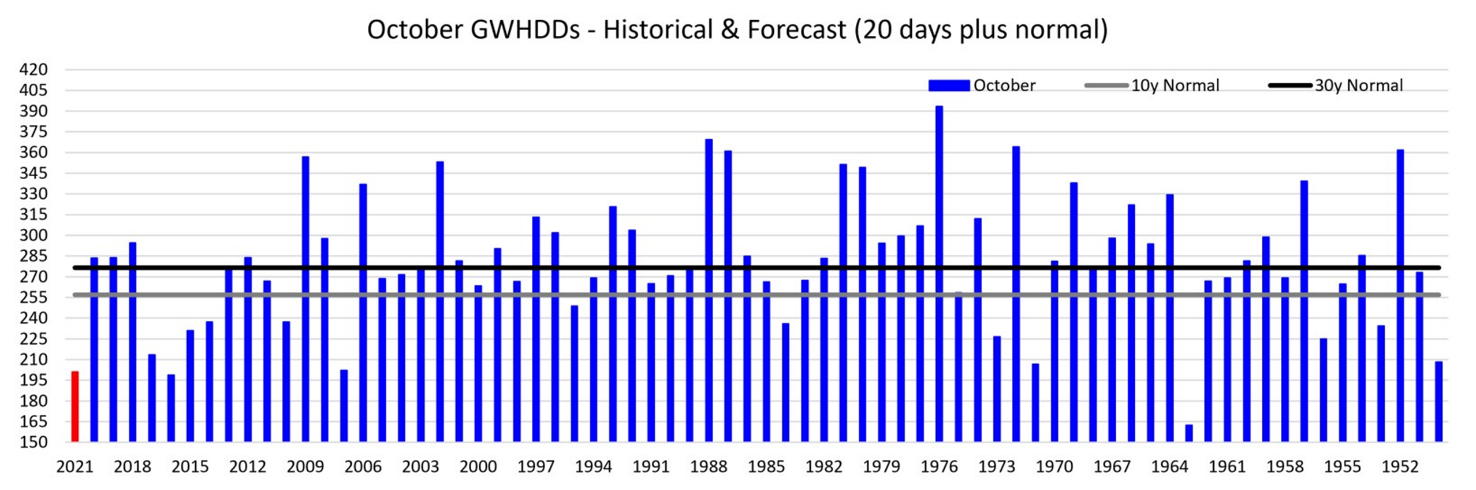
For October overall, we dropped our forecast to 220 GWHDDs earlier this week. This would rank as the 7th fewest for the month back to 1950. The main concern at this point is whether a recurving Typhoon Mindulle may alter the pattern; this is a risk for the 6-10 and 11-15 Day periods. There may yet be downside risk to the 220 GWHDD forecast given the record low GWHDD start to the month. Here is where October stands if assuming a normal final third of the month:
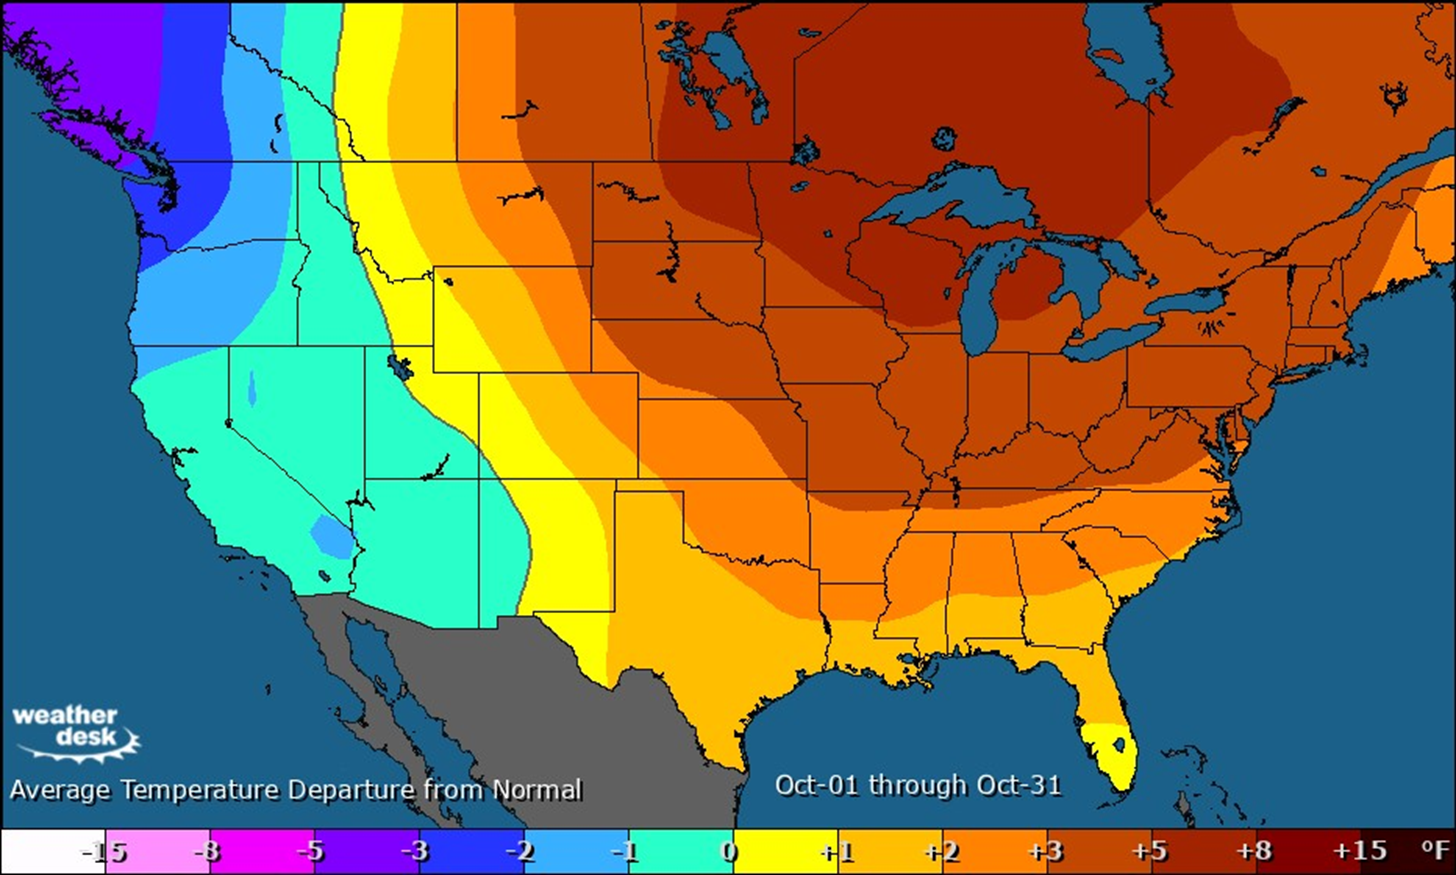
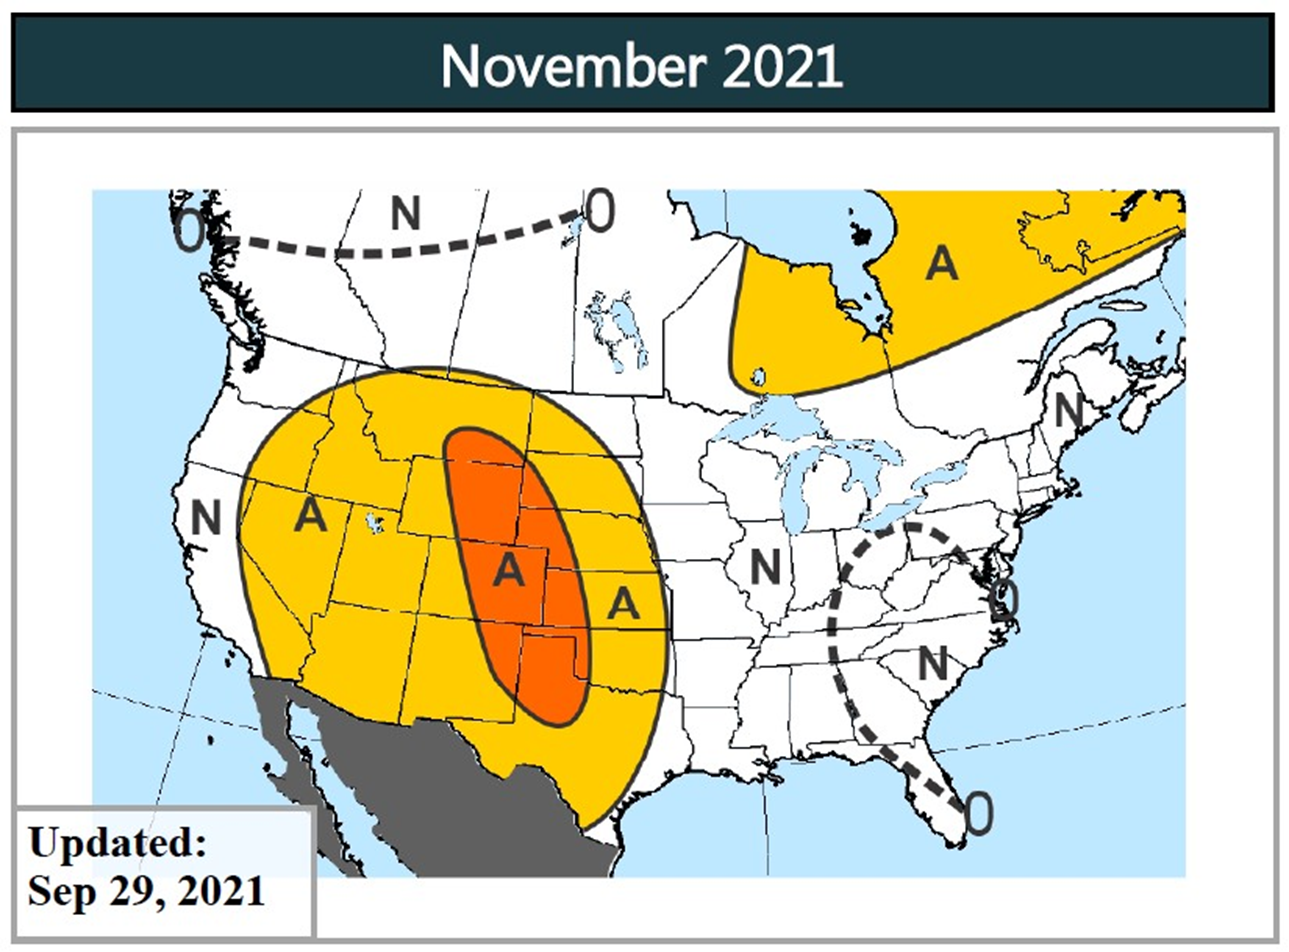
With the strong La Nina, Maxar is also forecasting a warm pattern for much of the Mountain and South Central regions in November. If this does play out, we anticipate injection into the first few weeks of November which would eliminate any concerns for low storage.
Fundamentals for the week ending Oct 01:
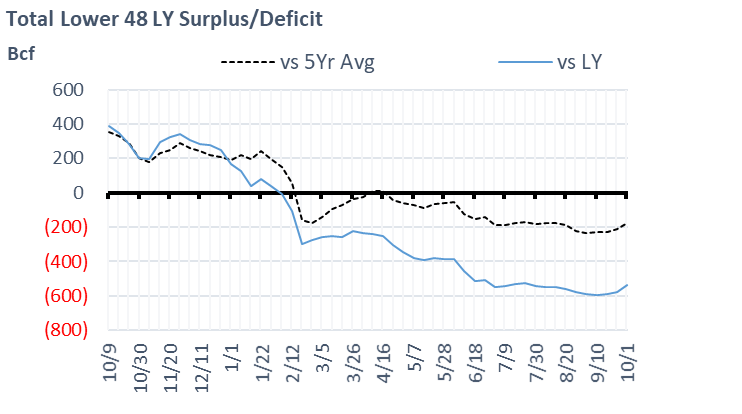
This past week the EIA reported a +88 Bcf storage injection for week ending Sept 24th. The report was in line with market expectations. The last few reports have indicated loosening conditions from the last few weeks of August, hence we expect storage levels to reach between 3550 and 3600. For the week ending October 1st, our early view is +115 Bcf. This is the first triple-digit build of a few based on the upcoming weather outlook. The 5Yr average is a +81 Bcf injection. Our projected injection would take the L48 storage level to 3285 Bcf (-535 vs LY, -179 vs. 5Yr). If we did not have the PG&E storage reclassification in early June (working->base), we would be 51 Bcf closer to the 5Yr average storage level.
Domestic dry gas production was higher by 0.3 Bcf/d to an average of 92.9 Bcf/d during the week. This week we saw a drop in production out of the Northeast, but an increase in onshore and offshore Gulf production which helped grow the outright production level week-on-week. We also see a big increase in Canadian imports this week. The increase of 0.5 Bcf/d was the result of less gas being exported from Michigan into Ontario’s Dawn storage facilities. This could be a result of East Can storage sitting at very high levels for the end of Sept, i.e. near levels we observed in 2020.
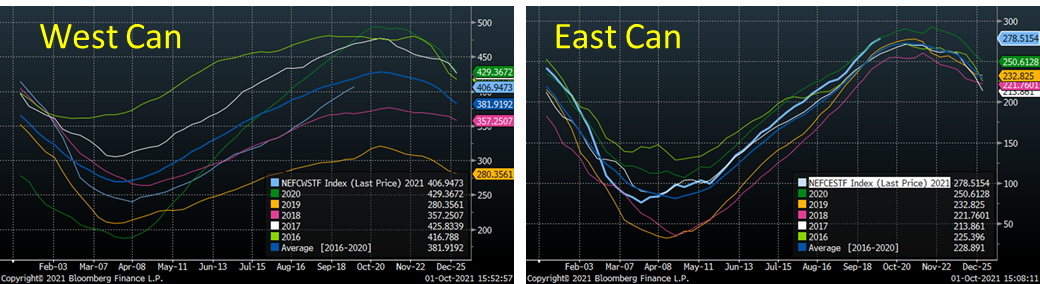
Typically gas traveling eastbound from Alberta moves on to the TransCanada mainline. The gas is usually destined for Ontario via two routes; either continuing on the mainline over the Great Lakes or existing midway onto the GLGT pipeline through the Midwest and then back into Canada from Mich to Ontario. This year with the low storage levels in the Midwest and high East Can storage levels, we are likely seeing gas being pushed into Midwest storage (current Midwest storage levels are 934 Bcf or -96 YoY).
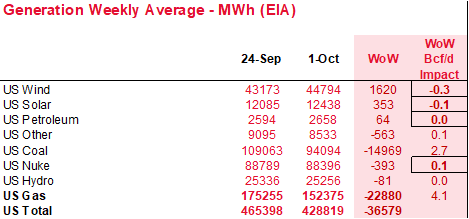
Total consumption was lower this week, primarily driven by a big drop in pwCDDs leading to lower burns. Total national power generation was lower by 7.9% from the previous week, with wind generation staying flat. The total drop in power gen came from a split between natgas and coal; hence the gas consumption for power was lower by 3-4 Bcf/d WoW.
Deliveries to LNG facilities averaged 10.3 Bcf/d, which was +0.4 Bcf/d higher than the previous. The drop in Cove Point was more than offset by Cameron returning from short maintenance and Freeport resuming operations after Hurricane Nicholas knocked out power.
The net balance is tighter by 3.4 Bcf/d week-on-week.
Expiration and rolls: UNG ETF roll starts on Oct 14th and ends on Oct 19th.
Nov futures expire on Oct 27th, and Mov options expire on Oct 26th.
This email, any information contained herein and any files transmitted with it (collectively, the Material) are the sole property of OTC Global Holdings LP and its affiliates (OTCGH); are confidential, may be legally privileged and are intended solely for the use of the individual or entity to whom they are addressed. Unauthorized disclosure, copying or distribution of the Material, is strictly prohibited and the recipient shall not redistribute the Material in any form to a third party. Please notify the sender immediately by email if you have received this email by mistake, delete this email from your system and destroy any hard copies. OTCGH waives no privilege or confidentiality due to any mistaken transmission of this email.