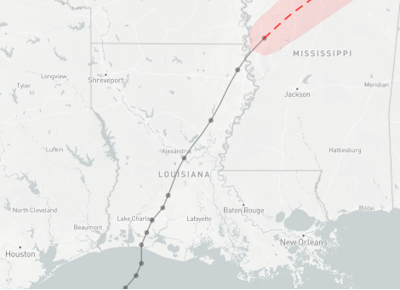
We start with an update on Hurricane Delta. Hurricane Delta made landfall in Louisiana on Friday with 100 mph winds and a 10-foot storm surge. The path was 15 miles from where the Hurricane Laura landed six weeks ago, but luckily this storm was weaker, more fast moving, and it rapidly weakened over land.
By Saturday morning, more than 540,000 customer were without power in LA. That number has been revised this morning to 345,000. Entergy put out a notice this morning stating that 50% of customers impacted by Delta had power restored already.
Today’s pipeline nomination shows no recover to offshore gas production yet, and shows a continued impact to Sabine and Cameron. Sabine is taking only 1.6 Bcf/d, while Cameron remains at 0. The good news is that Cameron appears to be power up from the Entergy maps; hence we could see LNG feedgas volumes pick up early this week.
Okay, now to our report for this week. As we enter winter, today we take a look at US LNG netbacks to get a better understanding of how much feedgas demand there might be from US LNG facilities over the next 12 months.
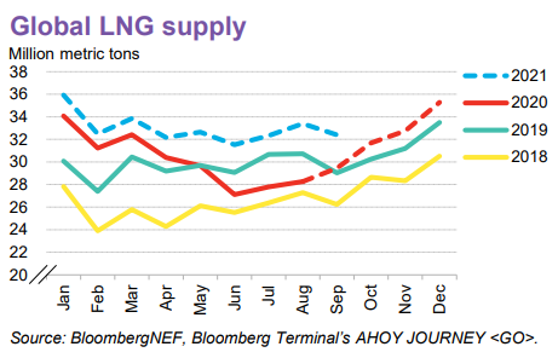
LNG flow and consumption peaks in the winter as 90% of the global population lives in the northern hemisphere. Natural gas demand is growing globally, and more supply is coming on to keep this emerging market balanced.
According to BNEF: “The global gas market will move past the impact of Covid-19 as it enters peak demand season. Summer LNG demand is estimated to be 3.6% lower than last year, but winter 2020-21 is set to see a 4.5% growth over last winter. Global LNG supply rebounds in the fourth quarter to cater to Asia’s increased gas needs.”
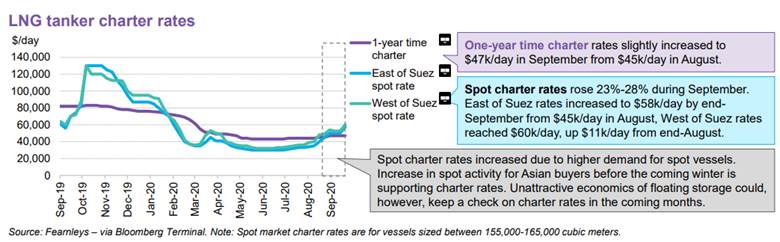
As winter approaches, there is already rising demand for spot cargoes for November deliveries. With no cargo cancellations in site and spot purchases from North Asia increasing, we see shipping charter rates rise as well.
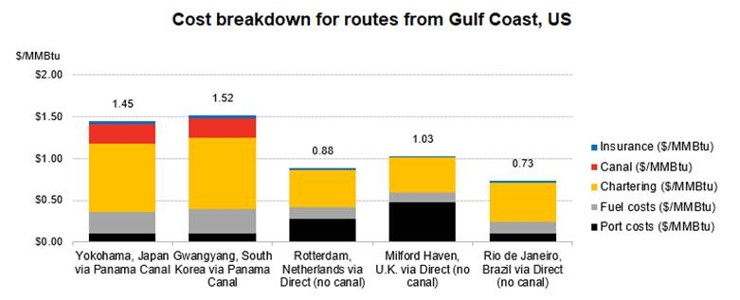
Taking the current charter rates and canal tolls, we ran the BNEF LNG Netback Shipping Calculator to better understand the cost to ship from the US to global destinations. The cost to North Asia is roughly ~$1.50/MMBtu while Europe is ~$0.90-1.00/MMBtu.
The ensure netbacks are positive, we have seen both Asian and European prices increase to keep the netbacks positive. The JKM price for Nov 2020 through Jan 2021 is currently trading at $5.52/MMBtu. This is equivalent to roughly 12% Brent indexed LNG prices – close to the long-term contracted LNG price slope index to Brent or JCC.
Below is the calculated netback (round-trip journey at an approximately $50k/day spot chart rate) for all the destination picked above based on the current forward strip.
– JKM prices is used as a proxy to Yokohama, Japan and Gwangyang, South Korea.
– TTF forward price is used for Rotterdam, Netherlands
- NBP forward price is used for Milford Haven, UK
- 12% Brent index price is used for Rio ds Janeiro, Brazil
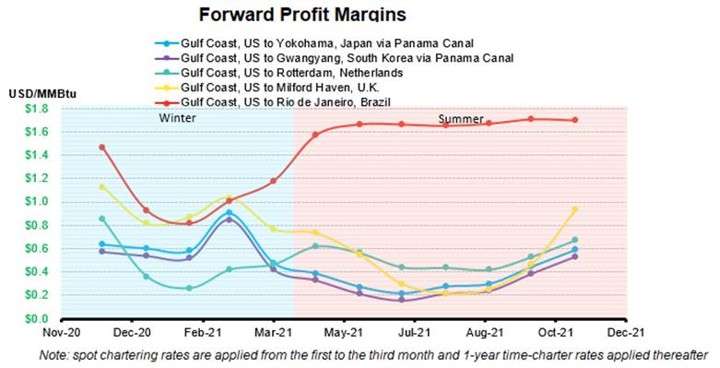
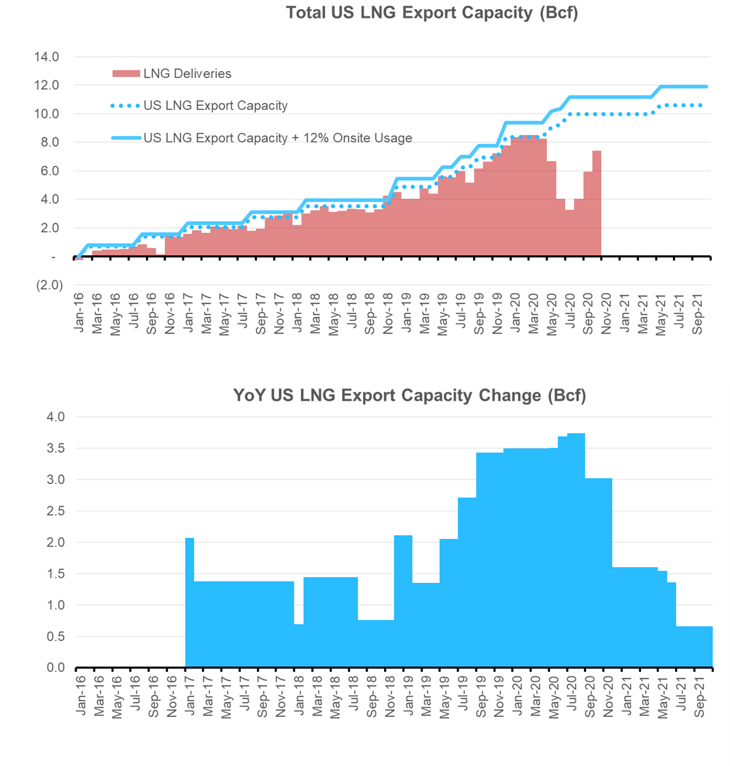
As can be seen, US LNG is in the money to flow throughout the coming winter and summer. If the full US capacity was utilized, then we could flow as much as 11.1 Bcf/d (9.96 Bcf/d export design capacity + 12% onsite usage) to the US LNG terminal this winter. For the summer, we could flow as much as 11.8 Bcf/d (10.54 Bcf/d export design capacity + 12% onsite usage) to the US LNG terminal.
There are some caveats to the above flows
1) Winter conditions in Europe and Asian will dictate the real demand
2) Europe currently has topped up storage, with additional gas stored in Ukraine
3) COVID-19 is likely to keep global demand lower
4) US balances for the summer are starting to look tight with the lower production levels; hence it’s a possibility the market will reprice to encourage cargo cancellations.
Fundamentals for week ending Oct 9: Our early view for the upcoming storage report is a +52 Bcf injection for the lower 48. This would take storage levels to 3883 Bcf. The industry estimates for this report range between 39-79 according to The Desk.
US natural gas dry production was higher week on week with domestic production averaging 85.5 Bcf/d for the week. The production is 0.2 Bcf/d lower week on week with increases in the Northeast offset by a drop in the South Central. Total natural gas demand was higher from the RC consumption picking up. Overall gas consumption was up 4.0 Bcf/d week-on-week.
Canadian imports were once again lower last week averaging 4.4 Bcf/d. Mexican exports averaged of 6.2 Bcf/d.
Deliveries to LNG facilities averaged 7.5 Bcf/d, up 0.7 Bcf/d week on week with Cameron slowly ramping up ahead of Hurricane Delta, and Corpus Christi resuming normal operations.
Expiration and rolls: UNG ETF roll starts on Oct 14th and ends on Oct 19th.
Nov futures expire on Oct 28th, and Nov options expire on Oct 27th.
This email, any information contained herein and any files transmitted with it (collectively, the Material) are the sole property of OTC Global Holdings LP and its affiliates (OTCGH); are confidential, may be legally privileged and are intended solely for the use of the individual or entity to whom they are addressed. Unauthorized disclosure, copying or distribution of the Material, is strictly prohibited and the recipient shall not redistribute the Material in any form to a third party. Please notify the sender immediately by email if you have received this email by mistake, delete this email from your system and destroy any hard copies. OTCGH waives no privilege or confidentiality due to any mistaken transmission of this email.