The week-on-week change in production was transparent with good visibility in the flow data, and the BSEE.gov report daily oil/gas shut-ins. The more difficult was understanding Ida’s impact on Gulf Coast industrial, and res/comm as Ida moved up from New Orleans to New York City. This report helps clarify that demand destruction was larger than expected.
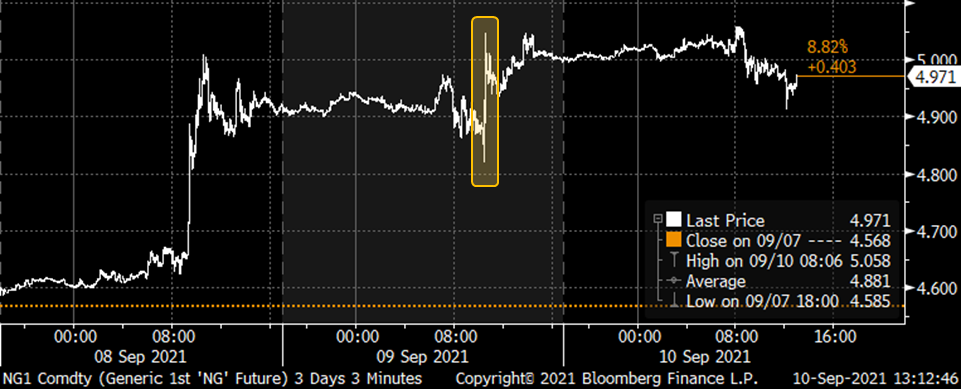
The market is more concerned now about the tight nature of the balances going into the winter. Most analysts are expecting the end of summer levels to fall between 3.4 and 3.5 Tcf, but the last few reports are showing tighter conditions (especially if GoM production doesn’t resume quickly).
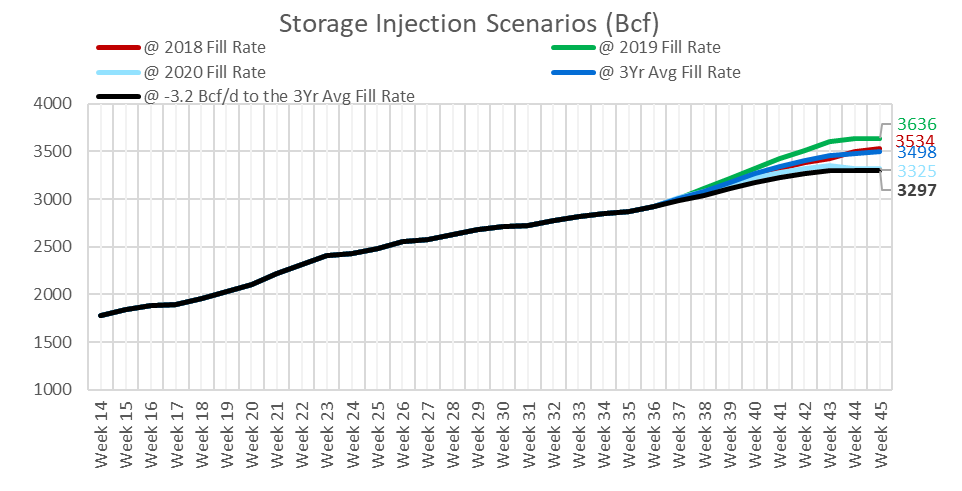
The last three reports showed injections being tighter by 3.2 Bcf/d (wx adj) on average versus the average 3Yr injection profile. If we assume similar conditions for the rest of summer, we could end up below 3300 Bcf by end of summer.
That being said, the recent market run-up seems to be less related to outright storage levels, but more with price not doing its job to rebalance the market. Typically, we’d see producers react to stronger pricing by deploying more rigs translating to more wells and production – but publicly traded producers have stuck to their “disciplined” drilling approach. The slight increase in gas rigs and frac jobs has been just enough to keep production flat this summer.
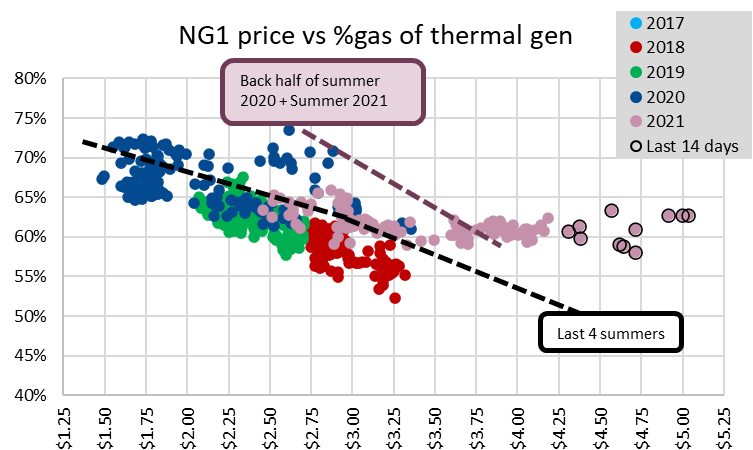
Price also instantaneously changes the order of the power stack by unwinding the C2G dynamic we have observed over the past few years. That hasn’t been the cast this summer as prices broke higher. The chart below shows the share of natgas generation of total thermal generation. The negative correlation between gas prices and gas generation ceased as we crossed the $3.25-3.50 range this summer.
For the week ending Sept 10th, our early view is +78 Bcf. The 5Yr average is also a +79 Bcf injection. Our projected injection would take the L48 storage level to 3001 Bcf (-600 vs LY, -236 vs. 5Yr). This past week remained disordered with Hurricane Ida, and we are likely to see a wide variance in storage estimates. This weekend also happens to be the historical peak of hurricane season, but luckily at the moment, there are no threatening storms in the Atlantic.
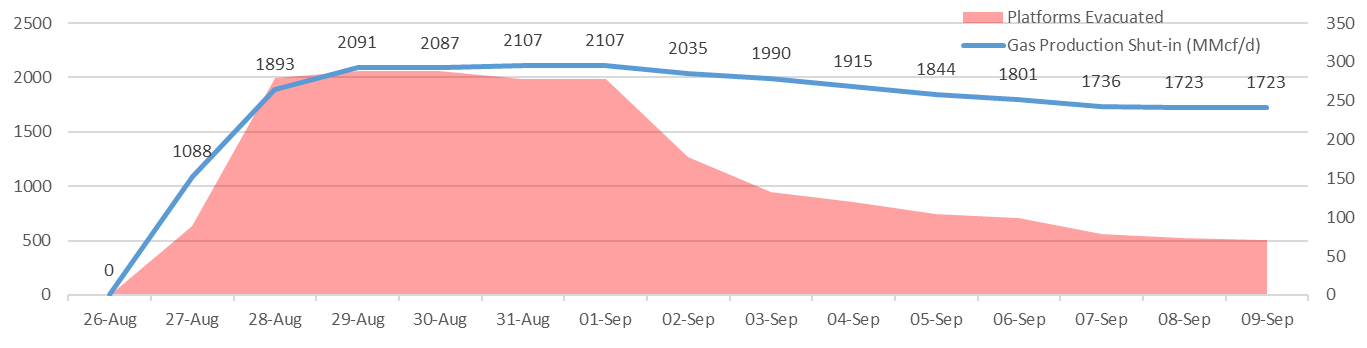
Domestic production was hit hard last week with Hurricane Ida ripping through the Gulf of Mexico and slamming into the Louisiana coast. Starting Aug 27th, production was lost from offshore (and some onshore locations) as a result of platform evacuations and damage/flood/power outage to pipeline/processing infrastructure. The shut-ins continued this past week despite offshore producers returning staff to offshore rigs. Here is some data from the Bureau of Safety and Environmental Enforcement showing platform evacuations versus natural gas shut-ins. The disconnect between GoM platform operations and shut-in volumes confirms onshore gas processing hindering production.
Entergy is hard at work to return power to the 4 southern Lousiana parishes that house the gas processing capacity.
*These represent no later than dates and the company will explore every option to expedite restoration.
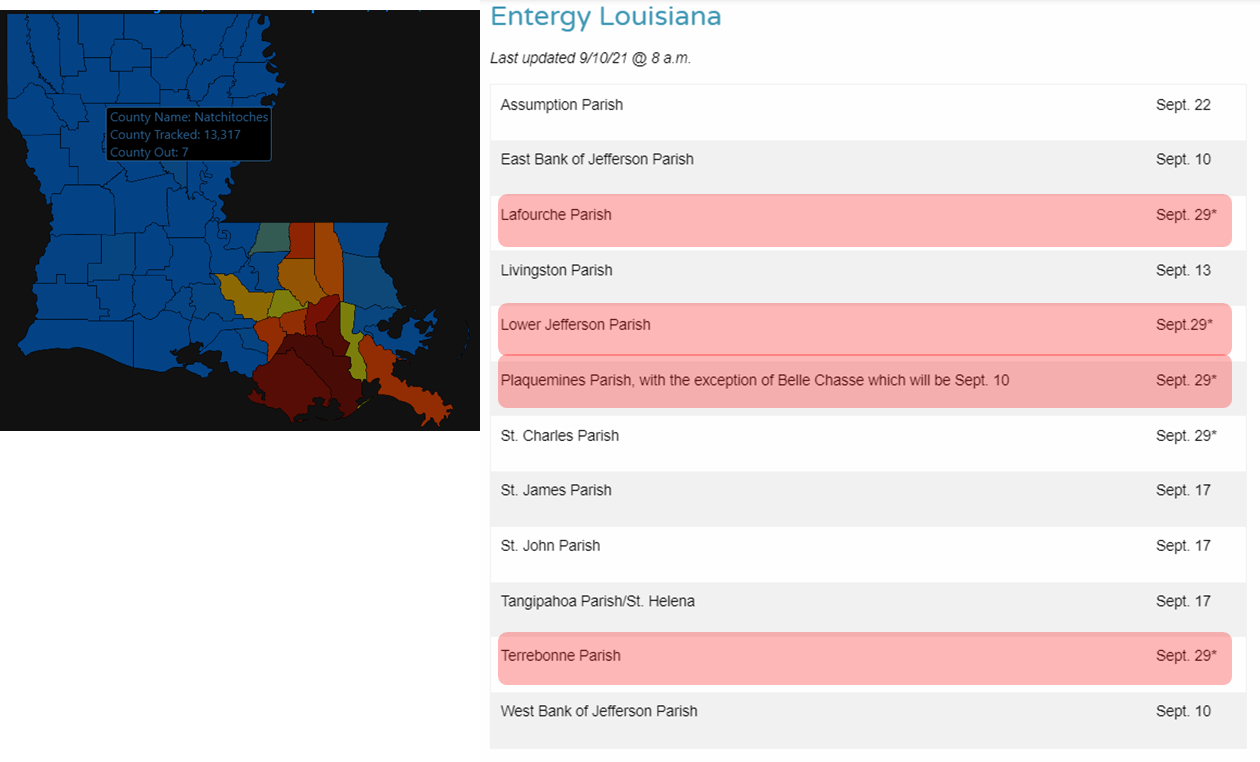
[Here is a good link to keep track of the restoration process: https://www.entergy.com/hurricaneida/etr/]
Overall, US dry gas production was higher by 0.2 Bcf/d to an average of 91.1 Bcf/d.
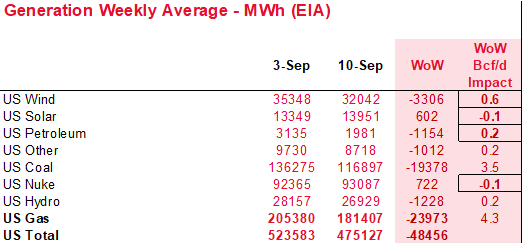
Total consumption was also lower this week, primarily driven by fewer pwCDDs leading to lower power burns. Total national temps were lower by 2.7F week-on-week. Total national power generation was lower by 9.3% from the previous week, and wind generation was proportionally lower.
The lower power burns were slightly offset by industrial demand returning. Gulf regional demand still looks to be lower than normal by 1 Bcf/d last week.
Deliveries to LNG facilities averaged 11.0 Bcf/d, which was +0.5 Bcf/d higher than the previous week. As the ambient temps drop, the capacity factor of these plants looks to be rising. The last time the 7-day rolling feedgas levels averaged 11 Bcf was the first week of July.
The net balance is looser by 3.8 Bcf/d week-on-week. We do expect this upcoming report to have a wide range.
Expiration and rolls: UNG ETF roll starts on Sept 14th and ends on Sept 17th.
Oct futures expire on Sept 28th, and Oct options expire on Sept 27th.
This email, any information contained herein and any files transmitted with it (collectively, the Material) are the sole property of OTC Global Holdings LP and its affiliates (OTCGH); are confidential, may be legally privileged and are intended solely for the use of the individual or entity to whom they are addressed. Unauthorized disclosure, copying or distribution of the Material, is strictly prohibited and the recipient shall not redistribute the Material in any form to a third party. Please notify the sender immediately by email if you have received this email by mistake, delete this email from your system and destroy any hard copies. OTCGH waives no privilege or confidentiality due to any mistaken transmission of this email.