Fundamentals for the week ending Sept 17: This past week the EIA reported a +83 Bcf storage injection for week ending Sept 10th. The report came in a few Bcf higher than expectations, but the market shook it off with no substantial price reaction. The range of estimates was quite wide with the unknowns from the residual impacts from Hurricane Ida, and the lower demand due to the holiday Monday.
The report once again indicated loosening condition from the last few weeks of August. We estimate this report being 0.6 Bcf/d tight versus the average wx-adjusted injection from the last 3 summers. The balances were looser even with wind generation dropping by 13% from week ending Sept 3rd.
For the week ending Sept 17th, our early view is +75 Bcf. The 5Yr average is also a +74 Bcf injection. Our projected injection would take the L48 storage level to 3081 Bcf (-590 vs LY, -230 vs. 5Yr). This past week remained disordered with Hurricane Ida and Hurricane Nicholas. We are likely to see a wide variance in storage estimates once again as analysts try to figure out the demand destruction associated with Hurricane Nicholas. This hurricane passed through the main energy corridor of Texas, and the one known facility that lost power was Freeport LNG. Freeport LNG production remained offline through Friday, as power transmission lines were knocked out leading to the facility. Freeport LNG is the only liquefaction terminal in the US and one of only a few in the world that uses exclusively electric motors instead of natural gas turbines to drive the liquefaction compressors. Freeport is now back up and running.

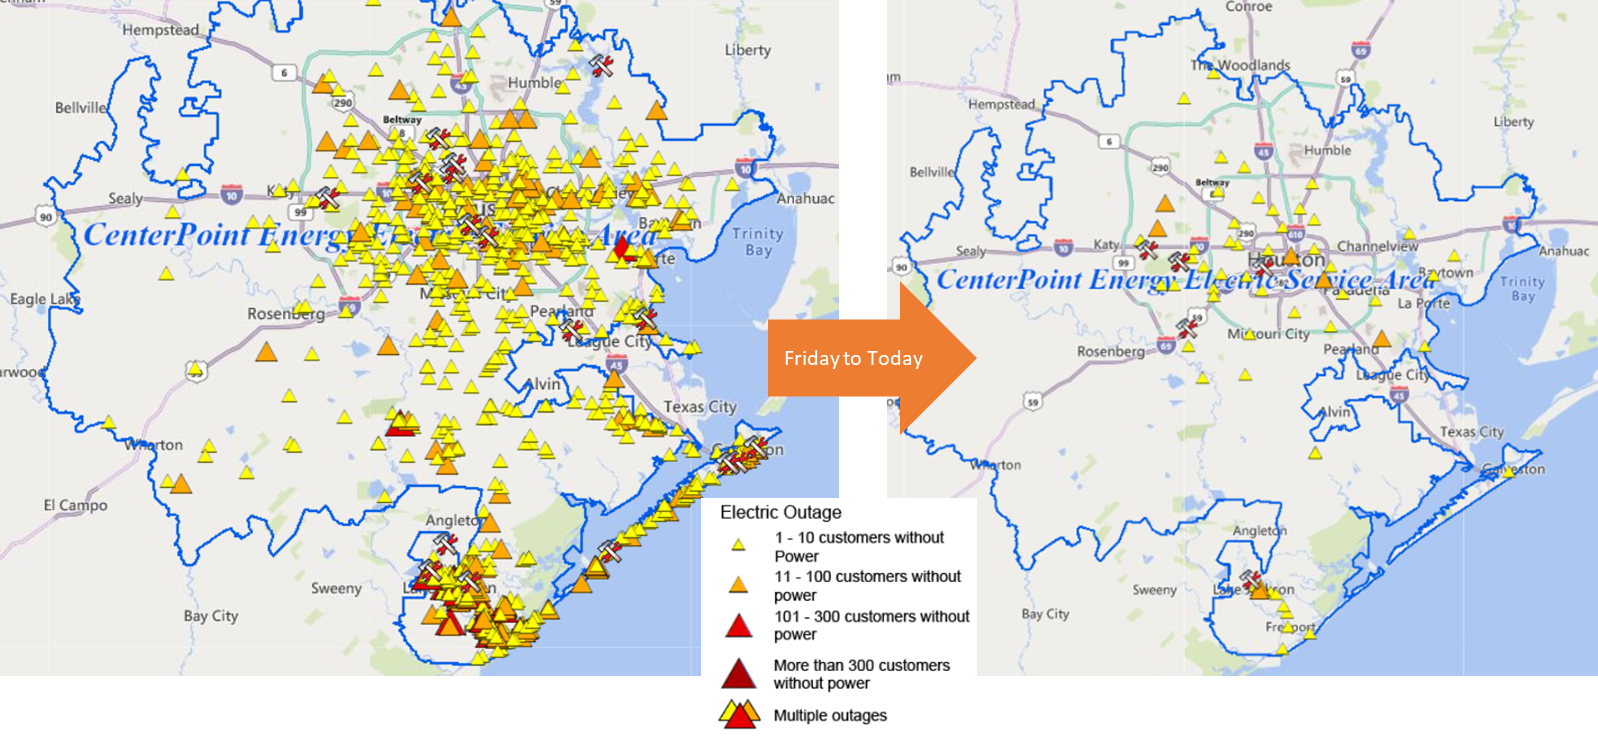
Centerpoint reports that most customers have received power back (99.9+%). This maps was full of outage up until this weekend.
[Get update data here: https://www.centerpointenergy.com/en-us/residential/services/electric-utility/outage-center?sa=ho]
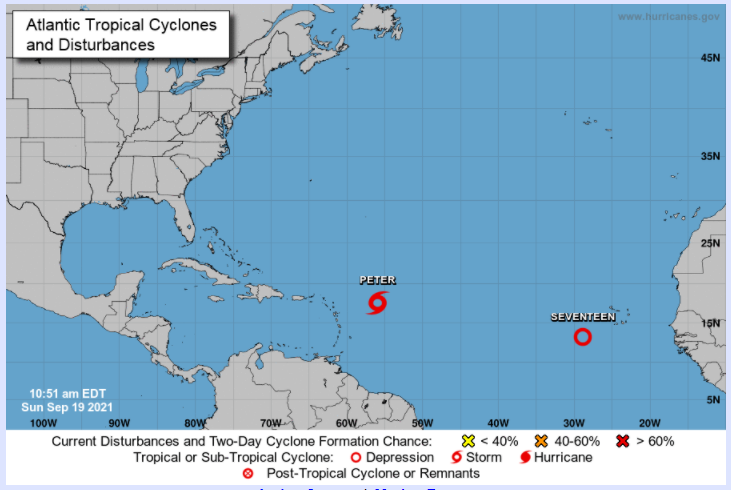
Last week was the historical peak of hurricane season, and from the latest NOAA hurricane view, there are more disturbances on the way. Get the latest NOAA look here: https://www.nhc.noaa.gov/
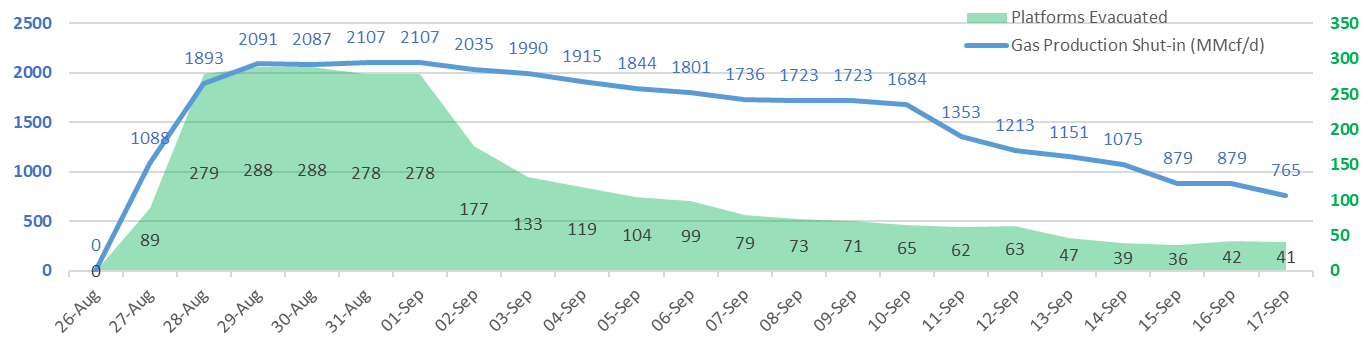
Domestic production continues to recover from Hurricane Ida ripping through the Gulf of Mexico and slamming into the Louisiana coast. We have had lower production from offshore rigs as of Aug 27th, despite most platform return staff and no major infrastructure damage. As we showed last week, there is a disconnect between GoM platform operations and shut-in volumes which points to onshore gas processing still stalling production. Here is the latest data from BSEE charted out to show that as of Friday we have 34% or 0.765 Bcf/d of production still offline.
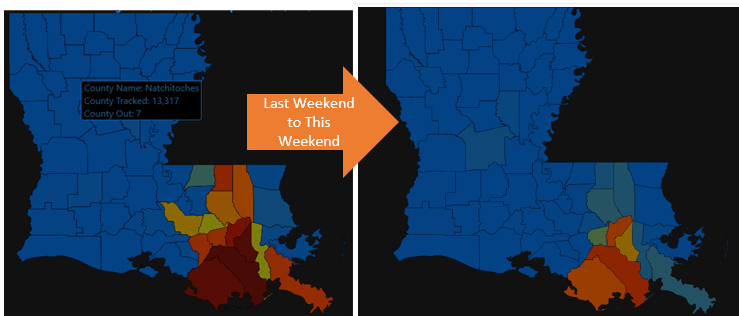
Entergy has made a lot of progress of the week in returning power to the 4 southern Louisiana parishes that house the gas processing capacity. The goal was to have all power restored by Sept 29th. Here is a good link to keep track of the restoration process: https://www.entergy.com/hurricaneida/etr/
Overall, US dry gas production was higher by 0.4 Bcf/d to an average of 91.8 Bcf/d. Another major event that took place late in the week was another TCO outage. MarkWest notified TCO of an operational issue that forced them to reduce production deliveries. TCO initially estimated a reduction in supply on the TCO system of approximately 2.2 Bcf.
Get the latest updates here: https://ebb.tceconnects.com/infopost/?nomobile=1
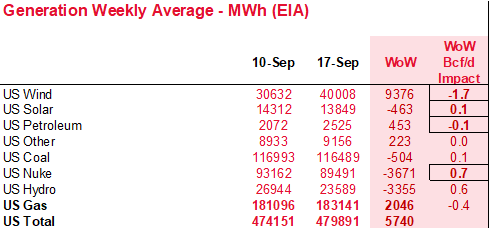
Total consumption was higher this week, primarily driven by returning LA industrial demand and higher pwCDDs leading to stronger burns. Total national temps were lower by 0.7F week-on-week. Total national power generation was higher by 1.2% from the previous week, but wind generation was much higher averaging 40 GWh through the week. We estimate the higher wind generation removed 1.7 Bcf/d of gas burns to help loosen the balances.
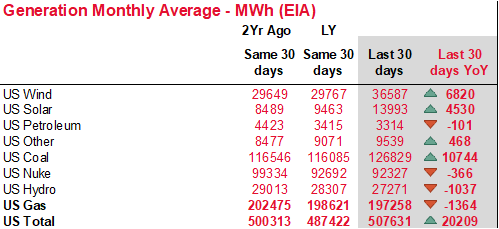
Another quick note on generation is the change in the power stack over the past couple of years with the added renewable generation and price of natural gas. The table below compares the same 30 day periods between 2019, 2020, and 2021. Some notable observations:
1) Overall power load is 4.1% higher than last year as the economy recovers from covid, and pretty much in line with 2019. We should note that we have made no adjustments for differences in weather, but 2019 was significantly warmer.
2) Wind & solar generation are significantly higher.
3) Natural gas generation is flat all through years, but coal is significantly higher despite plant retirements. The unwind of C2G due to price would have been more significant with the recent price move if it weren’t for lower coal production, and coal plant retirements.
Deliveries to LNG facilities averaged 10.2 Bcf/d, which was -0.7 Bcf/d lower than the previous week due to Hurricane Nicholas knocking out power at Freeport. Corpus Christie was also slightly lower off with lower feedgas volumes due to short-term maintenance. As of today, LNG feedgas are back up to 10.84 Bcf/d. One thing to keep a look out for is annual maintenance on Cove Point which usually starts in the back half of September and typically last 3-4 weeks.
The net balance is tighter by -0.8 Bcf/d week-on-week.
Expiration and rolls: UNG ETF roll starts on Oct 14th and ends on Oct 19th.
Oct futures expire on Sept 28th, and Oct options expire on Sept 27th.
This email, any information contained herein and any files transmitted with it (collectively, the Material) are the sole property of OTC Global Holdings LP and its affiliates (OTCGH); are confidential, may be legally privileged and are intended solely for the use of the individual or entity to whom they are addressed. Unauthorized disclosure, copying or distribution of the Material, is strictly prohibited and the recipient shall not redistribute the Material in any form to a third party. Please notify the sender immediately by email if you have received this email by mistake, delete this email from your system and destroy any hard copies. OTCGH waives no privilege or confidentiality due to any mistaken transmission of this email.