From: Terry Reilly
Sent: Thursday, July 12, 2018 8:17:40 AM (UTC-06:00) Central Time (US & Canada)
Subject: FI Morning Grain Comments 07/12/18
PDF attached
- 6-10 is drier for the southeastern Delta and temps are cooler for the eastern Midwest. 11-15 day is wetter for the north central Plains and temps are cooler for the northeastern Midwest.
- The evening GFS model run in the United States increased rainfall in much of Minnesota and northeastern South Dakota Wednesday. In week 2, rainfall was increased from northeastern South Dakota through central Minnesota and from northeastern Kansas into Illinois Jul. 19-21. (World Weather)
- The US Midwest will be hot though the weekend.
- The US Midwest will see several rounds of timely rain are expected during the next two weeks, but not heavy in any locations. Some areas may receive multiple events, resulting in slowing of development.
- For areas that receive little or no precipitation, we believe crop stress is most vulnerable across eastern Kansas into Missouri and portions of southeastern Iowa and west-central Illinois. These areas show short top soil moisture, and should be monitored over the next couple of weeks.
- Rain prospects improve for the Delta.
- Periodic rainfall and warm temperatures should be good for summer crop development for US hard red wheat.
- There are no issues with Brazil second corn crop harvesting.
- Europe will continue to see net drying in parts of the northern and western growing regions, but in general weather is expected to improve this weekend into next week for many dry areas.
- Net drying is expected to persist across eastern Ukraine and in Russia’s southern, central and Volga regions.
- Australia will see an increase in net drying.
Source: World Weather Inc. and FI
SIGNIFICANT CORN AND SOYBEAN BELT PRECIPITATION EVENTS
WEST CORN BELT EAST CORN BELT
Tdy-Fri 40% cvg of up to 0.75” and local amts over 2.0”; Mostly dry with a few insignificant showers
east-central and SE S.D. to Wi. wettest; south and
far NW driest.
Sat 15% cvg of up to 0.35” and local amts to 0.60”;
wettest west and north
Sat-Mon 80% cvg of up to 0.75”and local amts to 2.0”
Sun-Tue 85% cvg of up to 0.75” and local amts to 2.0”
Tue 20% cvg of up to 0.65” and local amts to 1.35”;
central areas wettest
Jul 18-19 40% cvg of up to 0.75” and local amts to 2.0”
Jul 18-20 60% cvg of up to 0.75” and local amts to 1.75”;
driest north
Jul 20-21 45% cvg of up to 0.35” and locally more;
wettest north
Jul 21-22 30% cvg of up to 0.25” and locally more
Jul 22-24 50% cvg of up to 0.40” and locally more
Jul 23-24 50% cvg of up to 0.40” and locally more
U.S. DELTA/SOUTHEAST SIGNIFICANT PRECIPITATION EVENTS
DELTA SOUTHEAST
Tdy-Sun 20-40% daily cvg of up to 0.75” and locally
more each day; rain shifts from NE to SW
during the period
Thu-Fri 5-20% daily cvg of up to 0.30” and locally
more each day
Sat-Sun 15-35% daily cvg of up to 0.40” and locally
more each day
Mon-Tue 55% cvg of up to 0.60” and local amts to 1.30”; 70% cvg of up to 0.75” and local amts to 1.75”
wettest north
Jul 18-19 60% cvg of up to 0.75” and local amts to 1.50”;
wettest north
Jul 18-21 15-35% daily cvg of up to 0.50” and locally
more each day
Jul 20-25 10-25% daily cvg of up to 0.30” and locally
more each day
Jul 22-25 10-25% daily cvg of up to 0.35” and locally
more each day
Source: World Weather Inc. and FI
Source: World Weather Inc. and FI
- USDA weekly net-export sales for corn, wheat, soy, cotton, 8:30am
- U.S. National Weather Service’s Climate Prediction Center will release its latest forecast for El Nino, 9am
- USDA’s monthly World Agricultural Supply and Demand Estimates (WASDE) report for July, noon
- Brazil coffee exporters group Cecafe releases data on shipments in June and the prospect for exports in 2018-19 crop
- Strategie Grains publishes monthly EU grains report
- Port of Rouen data on French grain exports
- Buenos Aires Grain Exchange weekly crop report
- Bloomberg weekly survey of analysts’ expectations on grain, sugar prices
- EARNINGS: Suedzucker
FRIDAY, JULY 13:
- China’s General Administration of Customs releases preliminary commodity trade data for June, including soy and palm oil, 10pm ET Thursday (10am Beijing Friday)
- ICE Futures Europe commitments of traders weekly report on coffee, cocoa, sugar positions, ~1:30pm ET (~6:30pm London)
- CFTC commitments of traders weekly report for period ending July 10 on positions for various U.S. futures and options, 3:30pm
- FranceAgriMer weekly updates on French crop conditions
Source: Bloomberg and FI
Bloomberg News surveys
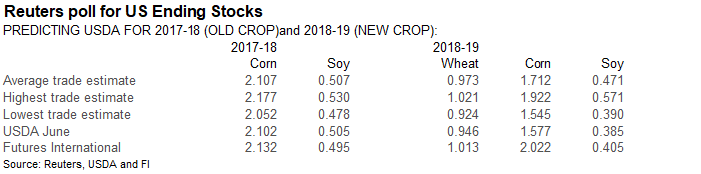
U.S. Corn, Soy, Wheat Inventory Survey Before USDA WASDE Report
================================================================
|———-Survey Results———–|USDA
2018-19 Crop: | Avg | Low | High | June
================================================================
Corn | 1,725| 1,455| 2,022| 1,577
Soybeans | 498| 380| 797| 385
Wheat | 985| 924| 1,084| 946
2017-18 Crop: |
Corn | 2,115| 2,058| 2,200| 2,102
Soybeans | 512| 478| 631| 505
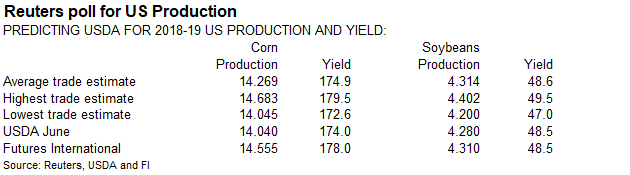
U.S. Corn, Soybean Production Survey Before USDA WASDE Report
================================================================
|———-Survey Results———–|USDA
2018-19 Crop: | Avg | Low | High | 2017-18
================================================================
Corn | 14,304| 14,045| 14,683| 14,040
Corn Yield | 175.1| 172.6| 179.5| 174.0
Soybeans | 4,324| 4,220| 4,430| 4,280
Soybean Yield | 48.7| 47.5| 50.0| 48.5
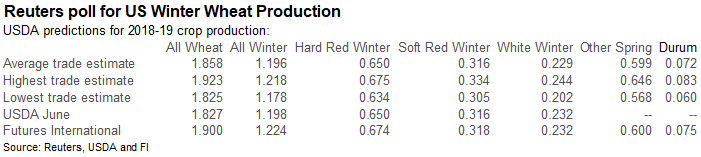
U.S. 2018 Wheat Production Survey Before USDA WASDE Report
================================================================
|———–Survey Results————|USDA
2018 Crop: | Avg | Low | High | June
================================================================
All Wheat | 1,860| 1,769| 1,923| 1,827
All Winter | | | |
Wheat | 1,199| 1,178| 1,224| 1,198
HRW | 652| 634| 675| 650
SRW | 316| 305| 334| 316
White Winter | 230| 202| 244| 232
Durum | 74| 60| 83|n/a
Other Spring | 600| 568| 646|n/a
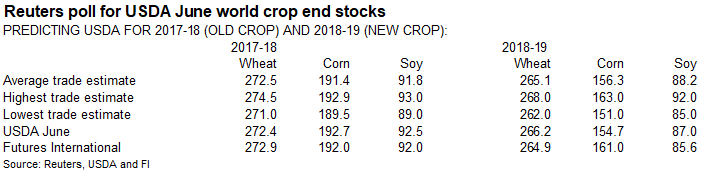
World Corn, Soybeans, Wheat Survey Before USDA WASDE Report
================================================================
|———-Survey Results———–|USDA
2018-19 Ending | | | |
Stocks: | Avg | Low | High | June
================================================================
Corn | 155.7| 151.0| 163.0| 154.7
Soybeans | 88.7| 85.6| 92.0| 87.0
Wheat | 263.7| 256.0| 268.0| 266.2
2017-18 Ending |
Stocks: |
Corn | 191.6| 188.0| 193.7| 192.7
Soybeans | 92.0| 89.0| 94.0| 92.5
Wheat | 272.2| 270.4| 274.5| 272.4
Brazil, Argentina Corn and Soy Survey Before USDA WASDE Report
================================================================
|———Survey Results———-|USDA
2017-18 crop: | Avg | Low | High | June
================================================================
Corn – Argentina | 32.7| 32.0| 33.0| 33.0
Corn – Brazil | 83.2| 79.2| 85.5| 85.0
Soybeans – | | | |
Argentina | 36.7| 35.5| 37.5| 37.0
Soybeans – Brazil | 118.9| 117.0| 120.0| 119.0
Source: Bloomberg and FI
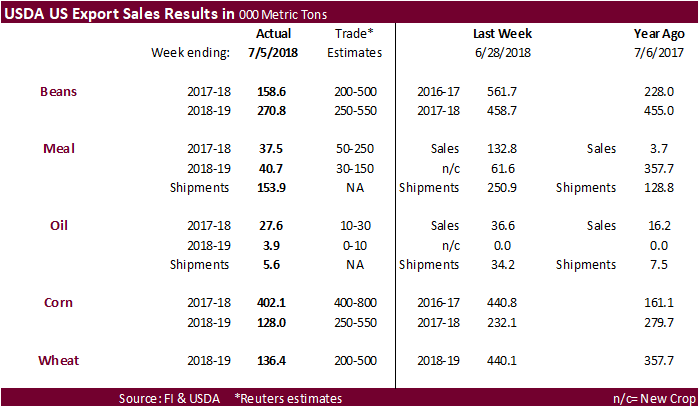
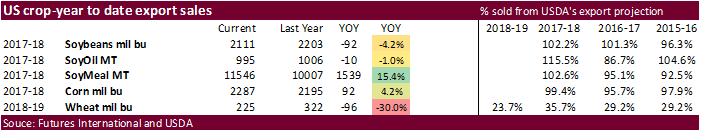
USDA US export sales were poor all around.
· USDA reported soybean export sales for the first week of July at 158,600 tons, below trade expectations and well below 561,700 tons last week. Reductions included unknown destinations for 296,900 tons. New-crop soybean sales were 270,800 tons versus 458,700 tons last week.
· USDA export sales for meal were a low 37,500 tons for 2017-18 and 40,700 tons for 2018-19. Shipments were 153,900 tons.
· Soybean oil export sales of 27,600 tons were ok. Shipments were a low 5,600 tons.
· USDA reported US corn export sales at 402,100 tons for 2017-18 and 128,000 tons for 2018-19. Both amounts were poor, in our opinion.
· All-wheat export sales were a dismal 136,400 tons.
· US stocks are higher, USD higher, WTI crude higher, and gold mostly lower, at the time this was written.
· There is speculation China and the US will come back to the table for trade talks. China, U.S. Hint at Chance for Talks After Trump’s Tariff Threat www.bloomberg.com/politics/articles/2018-07-11/u-s-china-trade-talks-said-to-stall-as-tariff-dispute-escalates
· Initial Jobless Claims:214K(est 225K, prevR 232k)
· Continuing Claims: 1739K(est 1730k, prevR 1742k)
· CPI (M/M) June: 0.1% (est 0.2%, prev 0.2%)
· CPI Ex Food And Energy (M/M) June: 0.2% (est 0.2%, prev 0.2%)
· CPI (Y/Y) June: 2.9% (est 2.9%, prev 2.8%)
· CPI Ex Food And Energy (Y/Y) June: 2.3% (est 2.3%, prev 2.2%)
· CPI Index NSA: 251.989 (est 252.092m, prev 251.588)
· CPI Core Index SA: 257.305 (est 257.361, prev 256.889)
· Real Avg Weekly Earning (Y/Y) June: 0.2% (prev 0.3%
· Real Avg Hourly Earning (Y/Y) June:0.0% (prev 0.0%)
· Canada New Housing Price Index (m/m) May: 0.0% (est 0.1%, prev 0.0%)
· Canada New Housing Price Index (y/y) May: 0.9% (est 1.0%, prev 1.6%)
Corn.
- Corn prices are higher on short covering and higher outside markets. Hot temperatures will set in across the US Midwest over the next week. Poor USDA export sales may limit gains, but South Korea is extending coverage through December.
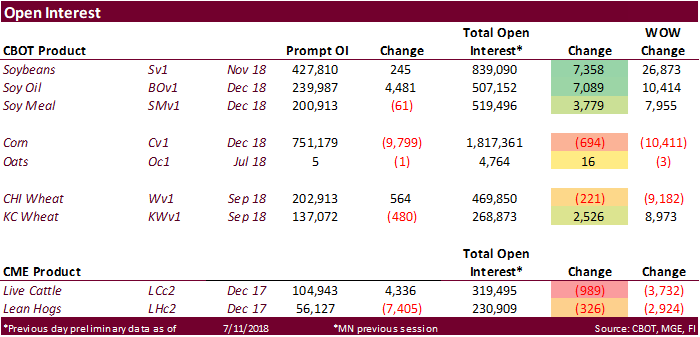
- Baltic Dry Index was up 46 points to 1,632, or 2.9%.
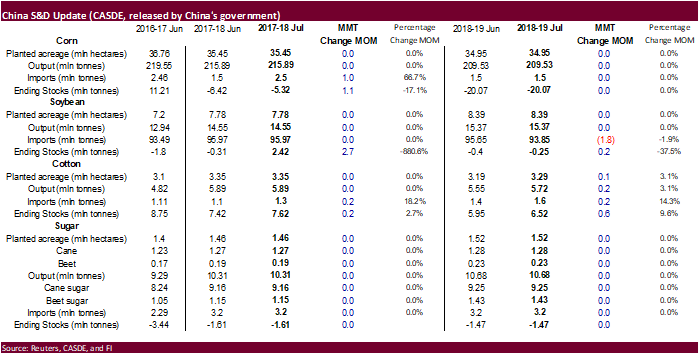
· China in its monthly CASDE report, increased its outlook for corn imports for 2017-18 to 2.5MMT from 1.5 million in June (+1.0MMT). CASDE has a very different view on corn production compared to USDA’s Attaché. CASDE is at 209.5MMT and USDA Attaché is at 222.0MMT.
· USDA may increase its yield later today from its current 174.0 bushels. We think they will go to 178.0 bushels.
· The weekly US DOE report showed ethanol stocks increasing 1.9 percent to 22.393 million barrels, or 418,000 barrels from the previous week. Traders were looking for a slight decrease in stocks.
· US ethanol production fell by most since February 9th by 34,000 barrels to 1.033 million, lowest inventory level since May 18. Traders were looking for a slight decrease (2).
· South Korea’s KFA bought 60,000 tons of optional origin corn at $205.74/ton c&f for arrival around December 5.
· South Korea’s NOFI group bought an unknown volume of optional origin corn at $204.28 a ton c&f for arrival around Dec. 25.
· China sold 1.235 million tons of corn out of state reserves at an average price of 1528 yuan per ton or $228.26/ton, 31 percent of the total offered.
· China will offer more corn on 13. China sold about 51-52 million tons of corn this season.
· The EU awarded 139,432 tons of duty free corn, exhausting its second half 2018 import quota.
USDA Attaché China corn S&D
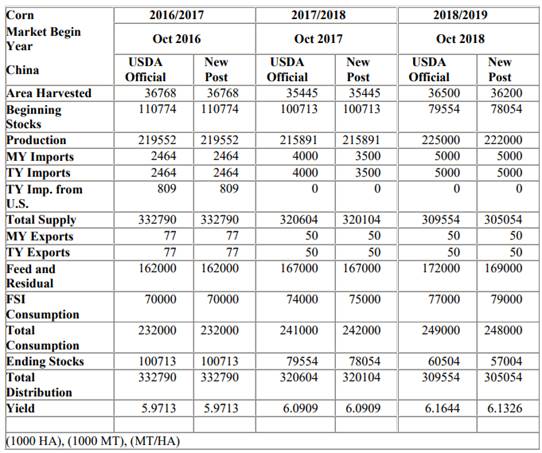
Source: USDA Attaché and FI
USDA Export Sales Highlights
- Corn: Net sales of 402,100 MT for 2017/2018 were down 9 percent from the previous week and 33 percent from the prior 4-week average. Increases were reported for South Korea (195,300 MT, including 130,000 MT switched from unknown destinations and decreases of 800 MT), Mexico (159,400 MT, including decreases of 9,200 MT), Japan (141,900 MT, including 51,800 MT switched from unknown destinations and decreases of 11,800 MT), Saudi Arabia (110,000 MT, including 101,000 MT switched from unknown destinations), and Indonesia (62,100 MT, switched from unknown destinations). Reductions were primarily for unknown destinations (435,100 MT) and El Salvador (16,400 MT). For 2018/2019, net sales of 128,000 MT were reported for Mexico (105,000 MT), unknown destinations (20,000 MT), and France (2,400 MT). Exports of 1,396,700 MT were down 8 percent from the previous week and 9 percent from the prior 4-week average. The destinations were primarily to Japan (294,600 MT), Mexico (276,000 MT), South Korea (198,100 MT), Saudi Arabia (110,000 MT), and Vietnam (83,000 MT). Optional Origin Sales: For 2017/2018, the current optional origin outstanding balance of 337,000 MT is for South Korea (206,000 MT), unknown destinations (91,000 MT), and Egypt (40,000 MT). For 2018/2019, new optional origin sales of 137,000 MT were reported for South Korea. The current outstanding balance of 325,000 MT is for South Korea (205,000 MT), Saudi Arabia (70,000 MT), and unknown destinations (50,000 MT).
- Barley: No net sales were reported for the week. Exports of 2,000 MT were to Japan.
- Sorghum: Net sales reductions of 38,800 MT, for 2017/2018 resulted as increases for China (2,100 MT), were more than offset by reductions for Mexico (38,000 MT) and unknown destinations (3,000 MT). Exports of 12,000 MT were to Japan (10,100 MT), China (1,000 MT), and Mexico (900 MT).
- Beef: Net sales of 16,200 MT for 2018 were up 25 percent from the previous week, but down 8 percent from the prior 4-week average. Increases were primarily for Japan (6,300 MT, including decreases of 2,500 MT), South Korea (4,000 MT, including decreases of 900 MT), Mexico (1,800 MT), Hong Kong (900 MT, including decreases of 200 MT), and Taiwan (800 MT, including decreases of 100 MT). For 2019, net sales of 200 MT were reported for Japan. Exports of 15,300 MT were down 17 percent from the previous and from the prior 4-week average. The primary destinations were Japan (5,800 MT), South Korea (3,600 MT), Taiwan (1,400 MT), Mexico (1,400 MT), and Canada (1,300 MT).
- Pork: Net sales of 9,200 MT for 2018 were down 44 percent from the previous week and 43 percent from the prior 4-week average. Increases were reported for Japan (3,600 MT), Australia (1,800 MT), Hong Kong (900 MT), Canada (900 MT), and Mexico (700 MT). Exports of 18,500 MT were down 9 percent from the previous week and 4 percent from the prior 4-week average. The primary destinations were Mexico (6,700 MT), Japan (3,300 MT), South Korea (2,300 MT), Canada (1,300 MT), and Hong Kong (1,100 MT).
Soybean complex.
· Soybeans are higher on technical buying and hints that the US and China will resume trade talks, which is supporting outside markets.
· China’s yuan is under pressure.
· China in its monthly CASDE report, lowered its outlook for soybean imports for 2018-19 to 93.85MMT from 95.65 million in June (-1.8MMT). CASDE mentioned China’s soybean import costs for soybeans could increase by 100 yuan ($14.95) per ton from the previous month’s forecast.
· A Chinese newspaper noted “China’s 25 percent import tariffs will drive up the cost of US soybean imports by 700-800 yuan per ton (about 105-120 US dollars; 80-90 pounds), which is about 300 yuan per ton (44 US dollars; 34 pounds) higher than Brazilian soybeans.”
· China has not bought US soybeans since late June.
· China September soybean futures decreased 23 yuan per ton or 0.6%, September meal was down 11 or 0.4%, China soybean oil down 20 (0.4%) and China September palm down 46 (1.0%).
· September China cash crush margins were last running at 51 cents, down from 63 yesterday and compares to 56 cents last week and 84 a year ago.
· China’s Sinograin said they do not need to depend on US soybeans for state reserves, citing China has ample stocks of soybeans (which is a government secret).
- The association of German farm cooperatives lowered its projection for Germany’s 2018 winter rapeseed crop to 3.55 million tons from 4.05 million in June, down 16.8 percent year on year.
· An Argentina lineup shows a good increase in soybean oil and soybean meal demand for first half July, and the volumes have already outpaced June.
· Rotterdam vegetable oils were unchanged to higher and SA soybean meal when delivered into Rotterdam were 1-5 euros higher as of early morning CT time.
· Palm oil prices are nearing a 3-year low.
· September Malaysian palm was 18 lower at MYR2186 and cash down $3.75 at $568.75.
· Oil World has a 2100MYR target ($519.80/ton) in the “medium term”.
· Malaysia will lower its August CPO export tax to 4.5 percent from 5 percent in July.
· Offshore values were leading soybean oil 41 points higher and meal $3.20/short ton higher.
· NOPA is due out with the US soybean crush on Monday, July 16.
- China will offer 61,000 tons of rapeseed oil on July 17.
- Iran seeks 30,000 tons of sunflower oil on July 10.
- Iran seeks 30,000 tons of palm olein oils on July 10.
- Iran seeks 30,000 tons of soybean oil on August 1.
· China sold 832,302 tons of soybeans out of reserves so far, this season.
USDA Export Sales Highlights
- Soybeans: Net sales of 158,600 MT for 2017/2018 were down 72 percent from the previous week and 62 percent from the prior 4-week average. Increases were reported for Egypt (176,000 MT, including 177,000 MT switched from unknown destinations and decreases of 9,200 MT), Indonesia (85,800 MT, including 68,000 MT switched from unknown destinations and decreases of 600 MT), Taiwan (68,300 MT, including 63,000 MT switched from unknown destinations and decreases of 100 MT), the United Arab Emirates (43,800 MT, including 40,000 MT switched from unknown destinations), and Japan (34,700 MT, including decreases of 400 MT). Reductions were for unknown destinations (296,900 MT) and Mexico (35,700 MT). For 2018/2019, net sales of 270,800 MT were reported for unknown destinations (150,500 MT), Argentina (60,000 MT), and Mexico (21,800 MT). Exports of 733,600 MT were down 22 percent from the previous week and 1 percent from the prior 4-week average. The destinations included Egypt (271,000 MT), Indonesia (101,100 MT), Taiwan (87,600 MT), China (71,300 MT), and Mexico (62,800 MT). Optional Origin Sales: For 2018/2019, the current optional origin outstanding balance of 228,000 MT is for China (165,000 MT) and unknown destinations (63,000 MT). Export for Own Account: New exports for own account totaling 29,700 MT were reported to Canada. The current outstanding balance of 130,900 MT is for Canada.
- Soybean Cake and Meal: Net sales of 37,500 MT for 2017/2018–a marketing-year low–were down 72 percent from the previous week and 68 percent from the prior 4-week average. Increases were reported for Portugal (27,500 MT, including 28,000 MT switched from unknown destinations and decreases of 500 MT), Vietnam (10,500 MT), the Dominican Republic (9,400 MT, including decreases of 1,500 MT), Canada (7,100 MT), and the Philippines (5,600 MT). Reductions were reported for Colombia (16,500 MT), Venezuela (9,600 MT), unknown destinations (6,500 MT), and El Salvador (3,000 MT). For 2018/2019, net sales of 40,700 MT were primarily for unknown destinations (36,000 MT). Exports of 153,900 MT were down 39 percent from the previous week and 41 percent from the prior 4-week average. The primary destinations were the Philippines (47,800 MT), Portugal (27,500 MT), Mexico (23,100 MT), Canada (17,600 MT), and Colombia (6,700 MT).
- Soybean Oil: Net sales of 27,500 MT for 2017/2018 were down 25 percent from the previous week, but up 33 percent from the prior 4-week average. Increases were primarily for unknown destinations (12,000 MT), Peru (8,000 MT), Jamaica (3,500 MT), and Colombia (2,200 MT). For 2018/2019, net sales of 3,900 MT were reported for Mexico (3,400 MT) and the Dominican Republic (500 MT). Exports of 5,600 MT were down 84 percent from the previous week and 74 percent from the prior 4-week average. The primary destinations were Colombia (3,500 MT), Mexico (1,600 MT), and Canada (400 MT).
· US wheat futures are higher on additional cuts to the EU wheat crop production and widespread commodity buying.
· USDA US all-wheat export sales were a dismal 136,400 tons.
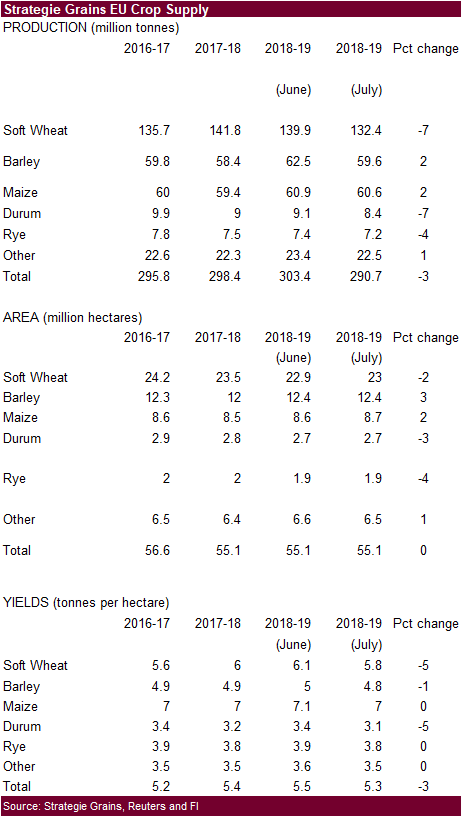
- Strategie Grains lowered their EU soft wheat crop production estimate by 7.5MMT to 132.4 million tons from 139.9 million (a 5.8MMT cut for France & Germany), down 7 percent from 2017. Barley was lowered to 59.6 million tons from 62.5 million, and corn to 60.6 million tons from 60.9 million tons. Soft wheat exports were lowered to 21.1MMT from 22.7MMT previously, but still higher than 20.7MMT in 2017-18.
- The association of German farm cooperatives lowered its projection for Germany’s 2018 wheat crop to 21.53 million tons from 22.89 in June, down 12.1 percent on the year. They mentioned the dry areas across the north and north east.
- December Paris wheat was up 1.00 euros to 182.25 euros in early US trading hours.
- Black sea wheat dropped again -1.75 yesterday sitting at 213.00 versus the recent range high of 216.25. (MPI)
- The USDA Attaché updated their S&D’s for Australia and wheat production for 2018-19 was estimated at 21 million tons, 12.5 percent below USDA’s official forecast of 24.0 million tons (MMT). This is lower than what we projected (23.2MMT), and we lowered output, based on a smaller harvested area, to 22 million tons. On June 12, ABARES lowered the Australian wheat production estimate by nearly 8 percent to 21.9 million tons.
· Saudi Arabia seeks 595,000 tons of wheat on Friday.
· Saudi Arabia seeks 1,740,000 million tons of fodder barley during the period September-October 2018.
- Bangladesh seeks 50,000 tons of optional origin milling wheat on July 25 for shipment within 40 days of contract signing.
- China sold 1,000 tons of 2013 imported wheat from state reserves at auction at an average price of 2380 yuan/per ton or $356.99/ton, 0.05 percent of what was offered.
· Japan bought 62,865 tons of milling wheat this week. (Reuters)
Details are as follows (in tons):
COUNTRY TYPE QUANTITY
U.S. Western White 17,177 *
U.S. Dark Northern Spring (protein minimum 14.0%) 11,353 *
Australia Standard White (West Australia) 34,335 *
Shipments: * Loading between Sept. 1 and Sept. 30, 2018
· The EU awarded 26,774 tons of duty free soft wheat.
- Japan in a SBS import tender seeks 120,000 tons of feed wheat and 200,000 tons of barley on July 18 for arrival by December 28.
· Jordan seeks 120,000 tons of barley for Oct/Nov shipment on July 17.
· Jordan seeks 120,000 tons of wheat on July 19 for Oct-Nov shipment.
Rice/Other
· Mauritius seeks 6,000 tons of white rice on July 13 for Sep 1-Nov 30 shipment.
- Thailand seeks to sell 120,000 tons of raw sugar on July 18.
- South Korea bought 82,800 tons of non-glutinous rice for arrival between September and December. Details for the purchased products are as follows:
TONNES(M/T) GRAIN TYPE PRICE($/T) ORIGIN ARRIVAL/PORT
20,000 Brown Short 638.00 Vietnam Sept 15/Incheon
20,000 Brown Short 648.00 Vietnam Sept 15/Ulsan
20,000 Brown Short 638.00 Vietnam Sept 15/Masan
10,000 Brown long 468.95 Thailand Sept 30/Mokpo
10,000 Brown long 467.40 Thailand Sept 30/Donghae
2,800 Milled Medium 513.80 Vietnam Dec 1-31/Busan
Source: Reuters and FI
USDA Export Sales Highlights
- Wheat: Net sales of 136,400 MT for 2017/2018 were down 69 percent from the previous week and the prior 4-week average. Increases were primarily for Nigeria (78,000 MT, including 30,000 MT switched from unknown destinations), the Philippines (75,800 MT, including 40,000 MT switched from unknown destinations), Guatemala (34,100 MT, including 32,300 MT switched from unknown destinations), Mexico (27,100 MT), and Indonesia (22,000 MT, including 20,000 MT switched from unknown destinations). Reductions were reported for unknown destinations (129,300 MT) and Nicaragua (4,000 MT). Exports of 285,900 MT were reported to Taiwan (49,300 MT), the Philippines (41,800 MT), Guatemala (37,300 MT), Mexico (36,700 MT), and Japan (33,200 MT).
- Rice: Net sales of 36,900 MT for 2017/2018 were up 36 percent from the previous week and 51 percent from the prior 4-week average. Increases were reported for Haiti (31,500 MT), Mexico (18,000 MT), Guatemala (1,500 MT), Canada (1,400 MT, including decreases of 700 MT), and the United Arab Emirates (800 MT). Reductions were reported for Colombia (17,500 MT). For 2018/2019, net sales of 17,500 MT were reported for Colombia. Exports of 22,400 MT were down 40 percent from the previous week and 39 percent from the prior 4-week average. The destinations were primarily to Haiti (14,800 MT), Mexico (1,800 MT), Canada (1,800 MT), Japan (1,300 MT), and the United Arab Emirates (800 MT).
- Cotton: Net sales of 121,600 running bales for 2017/2018 were up noticeably from the previous week and from the prior 4-week average. Increases were reported for Vietnam (93,500 RB, including 1,300 RB switched from China and decreases of 200 RB), Turkey (7,000 RB), China (5,600 RB), Indonesia (4,000 RB, including 500 RB switched from Japan and 300 RB switched from unknown destinations), and Algeria (3,300 RB). Reductions were reported for Japan (700 RB) and unknown destinations (300 RB). For 2018/2019, net sales of 251,400 RB reported for Vietnam (126,900 RB), Guatemala (48,400 RB), Mexico (25,400 RB), and South Korea (15,900 RB), were partially offset by reductions for Honduras (400 RB) and Japan (300 RB). Exports of 257,400 RB were down 38 percent from the previous week and 34 percent from the prior 4-week average. The primary destinations were Vietnam (68,700 RB), Turkey (49,400 RB), Indonesia (32,200 RB), China (23,400 RB), and Mexico (18,400 RB). Net sales of Pima totaling 1,900 RB for 2017/2018 were up 82 percent from the previous week, but down 30 percent from the prior 4-week average. Increases were reported for China (1,700 RB, switched from Hong Kong), Thailand (1,100 RB), Bangladesh (500 RB), and South Korea (500 RB, switched from Vietnam). Reductions were for Hong Kong (1,700 RB). For 2018/2019, net sales of 1,900 RB were reported for India (1,300 RB), China (400 RB), and Egypt (200 RB). Exports of 17,200 RB were up 43 percent from the previous week and 66 percent from the prior 4-week average. The primary destinations were China (4,900 RB), India (2,600 RB), Mexico (1,800 RB), Thailand (1,500 RB), and Turkey (1,300 RB). Optional Origin Sales: For 2017/2018, options were exercised to export 1,400 RB to Indonesia from the United States. The current optional origin outstanding balance is 6,400 RB, all Indonesia. Exports for Own Account: The current outstanding balance of 13,000 RB is for Vietnam (6,300 RB), China (6,200 RB), and Bangladesh (500 RB).
U.S. EXPORT SALES FOR WEEK ENDING 7/5/2018
|
|
CURRENT MARKETING YEAR |
NEXT MARKETING YEAR |
||||||
|
COMMODITY |
NET SALES |
OUTSTANDING SALES |
WEEKLY EXPORTS |
ACCUMULATED EXPORTS |
NET SALES |
OUTSTANDING SALES |
||
|
CURRENT YEAR |
YEAR |
CURRENT YEAR |
YEAR |
|||||
|
|
THOUSAND METRIC TONS |
|||||||
|
WHEAT |
|
|
|
|
|
|
|
|
|
HRW |
63.6 |
1,121.7 |
1,659.2 |
59.1 |
410.6 |
1,381.5 |
0.0 |
0.0 |
|
SRW |
10.1 |
505.1 |
665.4 |
50.6 |
251.0 |
251.5 |
0.0 |
0.0 |
|
HRS |
39.7 |
1,440.1 |
1,529.1 |
88.6 |
530.6 |
818.3 |
0.0 |
0.0 |
|
WHITE |
3.1 |
1,155.1 |
1,565.5 |
81.6 |
565.9 |
676.6 |
0.0 |
0.0 |
|
DURUM |
20.0 |
139.8 |
127.5 |
6.0 |
8.6 |
75.6 |
0.0 |
0.0 |
|
TOTAL |
136.4 |
4,361.7 |
5,546.8 |
285.9 |
1,766.7 |
3,203.4 |
0.0 |
0.0 |
|
BARLEY |
0.0 |
43.3 |
26.3 |
2.0 |
5.6 |
3.9 |
0.0 |
0.0 |
|
CORN |
402.1 |
11,532.5 |
7,471.6 |
1,396.7 |
46,562.8 |
48,291.9 |
128.0 |
4,647.9 |
|
SORGHUM |
-38.8 |
297.4 |
393.7 |
12.0 |
4,861.2 |
4,169.0 |
0.0 |
38.0 |
|
SOYBEANS |
158.6 |
7,164.7 |
6,663.4 |
733.6 |
50,285.9 |
53,291.2 |
270.8 |
8,253.0 |
|
SOY MEAL |
37.5 |
2,270.7 |
1,891.6 |
153.9 |
9,274.8 |
8,115.3 |
40.7 |
493.1 |
|
SOY OIL |
27.5 |
204.4 |
114.2 |
5.6 |
791.0 |
891.5 |
3.9 |
23.2 |
|
RICE |
|
|
|
|
|
|
|
|
|
L G RGH |
-0.5 |
110.0 |
180.8 |
1.1 |
1,152.7 |
1,251.1 |
17.5 |
61.0 |
|
M S RGH |
0.0 |
0.0 |
9.5 |
0.0 |
52.7 |
186.4 |
0.0 |
0.0 |
|
L G BRN |
-0.7 |
2.7 |
5.1 |
0.0 |
14.8 |
21.0 |
0.0 |
0.0 |
|
M&S BR |
0.1 |
0.2 |
4.1 |
0.1 |
66.6 |
188.5 |
0.0 |
0.0 |
|
L G MLD |
37.4 |
81.8 |
218.4 |
18.6 |
873.4 |
793.3 |
0.0 |
0.0 |
|
M S MLD |
0.6 |
104.1 |
45.7 |
2.7 |
513.1 |
785.2 |
0.0 |
1.3 |
|
TOTAL |
36.9 |
298.8 |
463.6 |
22.4 |
2,673.4 |
3,225.3 |
17.5 |
62.2 |
|
COTTON |
|
THOUSAND RUNNING BALES |
||||||
|
UPLAND |
121.6 |
2,527.7 |
1,734.7 |
257.4 |
13,780.3 |
12,838.2 |
251.4 |
5,832.8 |
|
PIMA |
1.9 |
68.2 |
60.7 |
17.2 |
571.0 |
570.2 |
1.9 |
169.6 |
Terry Reilly
Senior Commodity Analyst – Grain and Oilseeds
Futures International │190 S LaSalle St., Suite 410│Chicago, IL 60603
W: 312.604.1366
AIM: fi_treilly
ICE IM: treilly1
Skype: fi.treilly

Trading of futures, options, swaps and other derivatives is risky and is not suitable for all persons. All of these investment products are leveraged, and you can lose more than your initial deposit. Each investment product is offered only to and from jurisdictions where solicitation and sale are lawful, and in accordance with applicable laws and regulations in such jurisdiction. The information provided here should not be relied upon as a substitute for independent research before making your investment decisions. Futures International, LLC is merely providing this information for your general information and the information does not take into account any particular individual’s investment objectives, financial situation, or needs. All investors should obtain advice based on their unique situation before making any investment decision. The contents of this communication and any attachments are for informational purposes only and under no circumstances should they be construed as an offer to buy or sell, or a solicitation to buy or sell any future, option, swap or other derivative. The sources for the information and any opinions in this communication are believed to be reliable, but Futures International, LLC does not warrant or guarantee the accuracy of such information or opinions. Futures International, LLC and its principals and employees may take positions different from any positions described in this communication. Past results are not necessarily indicative of future results.