From: Terry Reilly
Sent: Thursday, July 19, 2018 7:48:42 AM (UTC-06:00) Central Time (US & Canada)
Subject: FI Weekly USDA Export Sales Snapshot 07/19/18
PDF attached
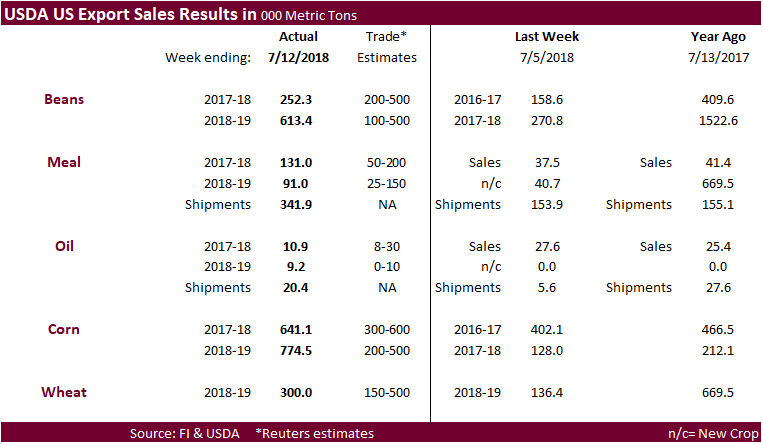
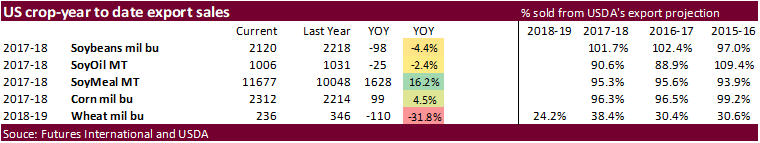
Both old and new-crop corn and soybean export sales were good.
Wheat sales were average. Corn sales positive along with shipments. Bean sales lag. Row crop shipment pace catching up. BRZ and ARG buying US grains…(MPI)
U.S. EXPORT SALES FOR WEEK ENDING 7/12/2018
|
|
CURRENT MARKETING YEAR |
NEXT MARKETING YEAR |
||||||
|
COMMODITY |
NET SALES |
OUTSTANDING SALES |
WEEKLY EXPORTS |
ACCUMULATED EXPORTS |
NET SALES |
OUTSTANDING SALES |
||
|
CURRENT YEAR |
YEAR |
CURRENT YEAR |
YEAR |
|||||
|
|
THOUSAND METRIC TONS |
|||||||
|
WHEAT |
|
|
|
|
|
|
|
|
|
HRW |
30.5 |
989.1 |
1,683.6 |
163.1 |
573.7 |
1,632.4 |
0.0 |
0.0 |
|
SRW |
70.7 |
506.0 |
713.7 |
69.7 |
320.7 |
294.9 |
0.0 |
0.0 |
|
HRS |
127.2 |
1,445.1 |
1,461.9 |
122.2 |
652.9 |
988.6 |
0.0 |
0.0 |
|
WHITE |
48.6 |
1,124.1 |
1,679.5 |
79.6 |
645.5 |
762.0 |
0.0 |
0.0 |
|
DURUM |
23.0 |
162.8 |
127.5 |
0.0 |
8.6 |
75.6 |
0.0 |
0.0 |
|
TOTAL |
300.0 |
4,227.1 |
5,666.2 |
434.7 |
2,201.4 |
3,753.5 |
0.0 |
0.0 |
|
BARLEY |
0.0 |
42.0 |
31.6 |
1.3 |
6.9 |
4.1 |
0.0 |
0.0 |
|
CORN |
641.0 |
10,880.5 |
6,896.3 |
1,293.0 |
47,855.9 |
49,333.8 |
774.5 |
5,422.4 |
|
SORGHUM |
-114.0 |
182.6 |
391.4 |
0.8 |
4,862.0 |
4,228.2 |
-38.0 |
0.0 |
|
SOYBEANS |
252.3 |
6,811.8 |
6,715.0 |
605.2 |
50,891.1 |
53,649.1 |
613.4 |
8,866.4 |
|
SOY MEAL |
131.0 |
2,059.8 |
1,778.0 |
341.9 |
9,616.7 |
8,270.2 |
91.0 |
584.1 |
|
SOY OIL |
10.9 |
195.0 |
112.0 |
20.4 |
811.4 |
919.1 |
9.2 |
32.4 |
|
RICE |
|
|
|
|
|
|
|
|
|
L G RGH |
18.1 |
109.1 |
166.7 |
19.0 |
1,171.7 |
1,292.0 |
5.7 |
66.7 |
|
M S RGH |
0.0 |
0.0 |
9.8 |
0.0 |
52.7 |
186.4 |
0.0 |
0.0 |
|
L G BRN |
0.1 |
2.2 |
5.1 |
0.7 |
15.5 |
21.2 |
0.0 |
0.0 |
|
M&S BR |
0.1 |
0.3 |
4.1 |
0.1 |
66.7 |
188.5 |
0.0 |
0.0 |
|
L G MLD |
3.9 |
65.8 |
202.8 |
19.8 |
893.2 |
819.2 |
0.0 |
0.0 |
|
M S MLD |
2.6 |
96.3 |
40.4 |
10.4 |
523.6 |
807.2 |
0.1 |
1.3 |
|
TOTAL |
24.8 |
273.6 |
428.8 |
50.0 |
2,723.4 |
3,314.4 |
5.8 |
68.0 |
|
COTTON |
|
THOUSAND RUNNING BALES |
||||||
|
UPLAND |
12.9 |
2,313.3 |
1,481.4 |
227.3 |
14,005.4 |
13,118.8 |
247.7 |
6,080.5 |
|
PIMA |
0.8 |
56.6 |
60.5 |
12.4 |
583.3 |
572.9 |
-2.9 |
166.8 |
Export Sales Highlights
This summary is based on reports from exporters for the period July 6-July 12, 2018.
Wheat: Net sales of 300,000 MT for 2018/2019 were up noticeably from the previous week, but down 25 percent from the prior 4-week average. Increases were reported for the Philippines (136,200 MT, including 60,000 MT switched from unknown destinations), Thailand (64,000 MT), Honduras (42,400 MT, including decreases of 200 MT), Argentina (30,000 MT), and Brazil (28,000 MT, including decreases of 2,000 MT). Reductions were reported for unknown destinations (24,000 MT), Trinidad (12,400 MT), and Nigeria (1,000 MT). Exports of 434,700 MT–a marketing-year high–were up 52 percent from the previous week and 19 percent from the prior 4-week average. The destinations were primarily to the Philippines (122,300 MT), Japan (101,000 MT), Mexico (67,800 MT), South Korea (56,200 MT), and Brazil (28,000 MT).
Corn: Net sales of 641,000 MT for 2017/2018 were up 59 percent from the previous week and 38 percent from the prior 4-week average. Increases were reported for Japan (123,800 MT, including 43,100 MT switched from unknown destinations and decreases of 2,100 MT), Mexico (123,200 MT, including decreases of 300 MT), Argentina (80,000 MT), Saudi Arabia (77,500 MT, including 73,000 MT switched from unknown destinations and decreases of 3,300 MT), and Egypt (75,800 MT, including 25,800 MT switched from Spain and decreases of 10,000 MT). Reductions were primarily for unknown destinations (96,600 MT), Spain (25,800 MT), the United Kingdom (21,000 MT), and France (20,000 MT). For 2018/2019, net sales of 774,500 MT were reported for Mexico (245,200 MT), South Korea (126,000 MT), El Salvador (99,700 MT), and Guatemala (96,100 MT). Exports of 1,293,000 MT were down 7 percent from the previous week and 16 percent from the prior 4-week average. The destinations were primarily to Mexico (335,700 MT), Japan (211,400 MT), South Korea (129,800 MT), Peru (77,600 MT), and Saudi Arabia (76,300 MT).
Optional Origin Sales: For 2017/2018, the current optional origin outstanding balance of 337,000 MT is for South Korea (206,000 MT), unknown destinations (91,000 MT), and Egypt (40,000 MT). For 2018/2019, new optional origin sales of 138,000 MT were reported for South Korea. The current outstanding balance of 463,000 MT is for South Korea (343,000 MT), Saudi Arabia (70,000 MT), and unknown destinations (50,000 MT).
Barley: No net sales were reported for the week. Exports of 1,300 MT were to Japan.
Sorghum: Net sales reductions of 114,000 MT were for Mexico. For 2018/2019, net sales reductions of 38,000 MT were reported for Mexico. Exports of 800 MT were to Mexico.
Rice: Net sales of 24,800 MT for 2017/2018 were down 33 percent from the previous week and 5 percent from the prior 4-week average. Increases were reported for Mexico (20,800 MT), Canada (2,800 MT, including decreases of 100 MT), Honduras (2,500 MT), Saudi Arabia (1,000 MT), and Israel (1,000 MT). Reductions were reported for El Salvador (3,400 MT) and Guatemala (1,000 MT). For 2018/2019, net sales of 5,800 MT were reported for Guatemala (5,700 MT) and Austria (100 MT). Exports of 50,000 MT were up noticeably from the previous week and 31 percent from the prior 4-week average. The destinations were primarily to Haiti (15,200 MT), Guatemala (9,000 MT), Mexico (7,500 MT), Japan (7,300 MT), and El Salvador (4,600 MT).
Soybeans: Net sales of 252,300 MT for 2017/2018 were up 59 percent from the previous week, but down 22 percent from the prior 4-week average. Increases were reported for the Netherlands (78,500 MT, including 87,500 MT switched from unknown destinations and decrease of 9,000 MT), Canada (74,300 MT), Iran (71,400 MT, including 67,000 MT switched from unknown destinations), Indonesia (70,400 MT, including 50,000 MT switched from unknown destinations and decreases of 100 MT), and Mexico (66,600 MT, including decreases of 1,000 MT). Reductions were for unknown destinations (113,000 MT), Egypt (60,000 MT), and the United Kingdom (12,000 MT). For 2018/2019, net sales of 613,400 MT reported for unknown destinations (433,000 MT), Argentina (120,000 MT), Mexico (27,000 MT), and Pakistan (25,000 MT), were partially offset by reductions for China (60,000 MT). Exports of 605,200 MT were down 18 percent from the previous week and 22 percent from the prior 4-week average. The destinations included Mexico (119,800 MT), Indonesia (91,400 MT), the Netherlands (78,500 MT), Iran (71,400 MT), and Pakistan (66,900 MT).
Optional Origin Sales: For 2018/2019, the current optional origin outstanding balance of 228,000 MT is for China (165,000 MT) and unknown destinations (63,000 MT).
Export for Own Account: The current outstanding balance of 130,900 MT is for Canada.
Soybean Cake and Meal: Net sales of 131,000 MT for 2017/2018 were up noticeably from the previous week and up 21 percent from the prior 4-week average. Increases were reported for Spain (66,000 MT, including 60,000 MT switched from unknown destinations), Colombia (29,000 MT, including 10,500 MT switched from unknown destinations), the Dominican Republic (21,700 MT), Mexico (15,300 MT, including decreases of 3,600 MT), and Vietnam (13,100 MT). Reductions were reported for unknown destinations (61,700 MT) and Nicaragua (3,000 MT). For 2018/2019, net sales of 91,000 MT were primarily for El Salvador (46,300 MT) and Guatemala (29,200 MT). Exports of 341,900 MT–a marketing year high–were up noticeably from the previous week and up 54 percent from the prior 4-week average. The primary destinations were the Philippines (95,400 MT), Spain (66,000 MT), Ecuador (31,900 MT), Colombia (30,600 MT), and Mexico (26,500 MT).
Soybean Oil: Net sales of 10,900 MT for 2017/2018 were down 60 percent from the previous week and 61 percent from the prior 4-week average. Increases were primarily for Venezuela (18,000 MT, switched from unknown destinations), Mexico (4,600 MT), Jamaica (3,500 MT), and Colombia (2,000 MT). Reductions were reported for unknown destinations (18,000 MT) and Nicaragua (400 MT). For 2018/2019, net sales of 9,200 MT were reported for the Dominican Republic. Exports of 20,400 MT were up noticeably from the previous week and up 6 percent from the prior 4-week average. The primary destinations were Venezuela (18,000 MT), Mexico (1,900 MT), and Canada (400 MT).
Cotton: Net sales of 12,900 running bales for 2017/2018 were down 89 percent from the previous week and up noticeably from the prior 4-week average. Increases were reported for Pakistan (6,900 RB, including decreases of 100 RB), China (5,900 RB, including 2,800 RB switched from Vietnam), South Korea (2,800 RB, including 1,500 RB switched from Vietnam), Vietnam (1,900 RB, including 300 RB switched from Japan and decreases of 200 RB), and Indonesia (1,800 RB, including 400 RB switched from Thailand and decreases of 400 RB). Reductions were reported for Turkey (8,000 RB), Japan (2,500 RB), and unknown destinations (800 RB). For 2018/2019, net sales of 247,700 RB were reported for Vietnam (93,400 RB), Pakistan (36,400 RB), Malaysia (26,900 RB), and China (24,300 RB). Exports of 227,300 RB were down 12 percent from the previous week and 33 percent from the prior 4-week average. The primary destinations were Vietnam (53,300 RB), Turkey (32,300 RB), Indonesia (26,300 RB), China (18,000 RB), and Mexico (15,500 RB). Net sales of Pima totaling 800 RB for 2017/2018 were down 58 percent from the previous week and 37 percent from the prior 4-week average. Increases were reported for Pakistan (1,200 RB), and Thailand (500 RB). Reductions were for China (1,400 RB), Japan (200 RB), and Colombia (100 RB). For 2018/2019, net sales reductions of 2,900 RB were reported for India (100 RB), were more than offset by reductions for China (3,000 RB). Exports of 12,400 RB were down 28 percent from the previous week and unchanged from the prior 4-week average. The primary destinations were India (5,000 RB), China (2,800 RB), Thailand (1,700 RB), and Vietnam (1,000 RB).
Optional Origin Sales: For 2017/2018, options were exercised to export 200 RB to Indonesia from the United States. The current optional origin outstanding balance is 6,200 RB, all Indonesia.
Exports for Own Account: The current outstanding balance of 13,000 RB is for Vietnam (6,300 RB), China (6,200 RB), and Bangladesh (500 RB).
Export Adjustment: Accumulated exports of upland cotton to South Korea were adjusted down 2,200 RB for week ending May 10th. The correct destination is Vietnam and is included in this week’s report.
Hides and Skins: Net sales of 314,500 pieces reported for 2018, all whole cattle hides, were down 15 percent from the previous week and 23 percent from the prior 4-week average. Increases were for China (152,700 pieces, including decreases of 25,300 pieces), South Korea (109,700 pieces, including decreases of 2,600 pieces), Mexico (24,900 pieces, including decreases of 3,100 pieces), and Thailand (20,700 pieces). Reductions were reported for Brazil (700 pieces) and Italy (700 pieces). Whole cattle hide exports of 408,900 pieces for 2018 were up 29 percent from the previous week and 16 percent from the prior 4-week average. The primary destinations were China (233,600 pieces), South Korea (80,200 pieces), Thailand (36,500 pieces), and Mexico (27,900 pieces).
Net sales of 123,800 wet blues for 2018 were up 30 percent from the previous week and 11 percent from the prior 4-week average. Increases were reported for China (48,300 unsplit and 2,400 grain splits), Italy (21,200 grain splits and 12,400 unsplit), Thailand (15,600 unsplit), and Taiwan (10,200 unsplit). Reductions were reported for Mexico (300 grain splits), South Korea (200 unsplit), and the Dominica Republic (100 unsplit). Exports of 107,300 wet blues for 2018 were down 12 percent from the previous week and 21 percent from the prior 4-week average. The primary destinations were China (33,000 unsplit and 4,500 grain splits), Thailand (17,300 unsplit and 8,400 grain splits), and Vietnam (24,900 unsplit). Net sales splits totaling 211,500 pounds for 2018 were down 80 percent the previous week and 67 percent from the prior 4-week average. The destination was Vietnam (211,500 pounds). Exports of 447,900 pounds were up noticeably from the previous week and 18 percent from the prior 4-week average. The destination was Vietnam.
Beef: Net sales of 13,500 MT for 2018 were down 17 percent from the previous week and 16 percent from the prior 4-week average. Increases were primarily for South Korea (5,700 MT, including decreases of 800 MT), Mexico (1,800 MT, including decreases of 100 MT), Taiwan (1,500 MT), Japan (1,400 MT, including decreases of 2,700 MT), and Canada (1,000 MT, including decreases of 100 MT). Reductions were reported for Indonesia (100 MT). For 2019, net sales of 100 MT were reported for Japan. Exports of 19,600 MT–a marketing-year high–were up 28 percent from the previous and 11 percent from the prior 4-week average. The primary destinations were Japan (6,300 MT), South Korea (5,900 MT), Mexico (2,000 MT), Taiwan (1,600 MT), and Canada (1,300 MT).
Pork: Net sales of 19,700 MT for 2018 were up noticeably from the previous week and up 33 percent from the prior 4-week average. Increases were reported for Japan (9,400 MT), Mexico (2,200 MT), Australia (1,900 MT), Canada (1,600 MT), and Colombia (1,200 MT). Exports of 18,700 MT were up 1 percent from the previous week and 3 percent from the prior 4-week average. The primary destinations were Mexico (6,300 MT), Japan (3,900 MT), South Korea (2,200 MT), Canada (1,300 MT), and Australia (1,200 MT).
Terry Reilly
Senior Commodity Analyst – Grain and Oilseeds
Futures International │190 S LaSalle St., Suite 410│Chicago, IL 60603
W: 312.604.1366
AIM: fi_treilly
ICE IM: treilly1
Skype: fi.treilly

Trading of futures, options, swaps and other derivatives is risky and is not suitable for all persons. All of these investment products are leveraged, and you can lose more than your initial deposit. Each investment product is offered only to and from jurisdictions where solicitation and sale are lawful, and in accordance with applicable laws and regulations in such jurisdiction. The information provided here should not be relied upon as a substitute for independent research before making your investment decisions. Futures International, LLC is merely providing this information for your general information and the information does not take into account any particular individual’s investment objectives, financial situation, or needs. All investors should obtain advice based on their unique situation before making any investment decision. The contents of this communication and any attachments are for informational purposes only and under no circumstances should they be construed as an offer to buy or sell, or a solicitation to buy or sell any future, option, swap or other derivative. The sources for the information and any opinions in this communication are believed to be reliable, but Futures International, LLC does not warrant or guarantee the accuracy of such information or opinions. Futures International, LLC and its principals and employees may take positions different from any positions described in this communication. Past results are not necessarily indicative of future results.