From: Terry Reilly
Sent: Thursday, August 23, 2018 10:23:07 AM (UTC-06:00) Central Time (US & Canada)
Subject: FI Weekly USDA Export Sales Snapshot 08/23/18
PDF attached
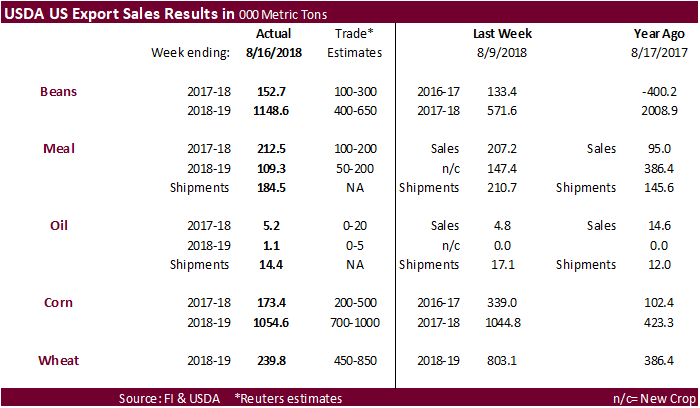
USDA corn and soybean exports sales were good. Soybean meal slipped a touch from the previous week, soybean oil slightly improved but still low. USDA wheat export sales were poor.
U.S. EXPORT SALES FOR WEEK ENDING 8/16/2018
|
|
CURRENT MARKETING YEAR |
NEXT MARKETING YEAR |
||||||
|
COMMODITY |
NET SALES |
OUTSTANDING SALES |
WEEKLY EXPORTS |
ACCUMULATED EXPORTS |
NET SALES |
OUTSTANDING SALES |
||
|
CURRENT YEAR |
YEAR |
CURRENT YEAR |
YEAR |
|||||
|
|
THOUSAND METRIC TONS |
|||||||
|
WHEAT |
|
|
|
|
|
|
|
|
|
HRW |
254.8 |
1,274.1 |
1,610.3 |
147.2 |
1,188.3 |
2,583.2 |
0.0 |
0.0 |
|
SRW |
7.6 |
539.9 |
565.7 |
47.0 |
544.4 |
580.6 |
0.0 |
0.0 |
|
HRS |
33.6 |
1,384.1 |
1,473.8 |
55.8 |
1,232.9 |
1,668.3 |
0.0 |
0.0 |
|
WHITE |
-56.2 |
941.7 |
1,372.3 |
198.7 |
1,259.0 |
1,490.5 |
0.0 |
0.0 |
|
DURUM |
0.0 |
153.1 |
98.9 |
11.7 |
39.4 |
104.0 |
0.0 |
0.0 |
|
TOTAL |
239.8 |
4,292.7 |
5,121.0 |
460.3 |
4,264.0 |
6,426.6 |
0.0 |
0.0 |
|
BARLEY |
2.4 |
40.1 |
29.0 |
0.2 |
11.4 |
7.3 |
0.0 |
0.0 |
|
CORN |
173.4 |
5,709.2 |
2,859.8 |
1,313.4 |
54,724.5 |
53,715.7 |
1,054.6 |
9,913.1 |
|
SORGHUM |
11.4 |
99.4 |
217.8 |
61.3 |
4,988.7 |
4,673.9 |
0.0 |
0.0 |
|
SOYBEANS |
152.7 |
4,243.8 |
4,005.9 |
626.5 |
54,517.9 |
56,714.0 |
1,148.6 |
12,626.2 |
|
SOY MEAL |
212.5 |
1,720.7 |
1,260.3 |
184.5 |
10,730.5 |
9,057.0 |
109.3 |
955.5 |
|
SOY OIL |
5.2 |
124.1 |
87.2 |
14.4 |
912.9 |
1,031.7 |
1.1 |
40.5 |
|
RICE |
|
|
|
|
|
|
|
|
|
L G RGH |
58.3 |
188.7 |
145.0 |
26.7 |
58.1 |
84.9 |
0.0 |
0.0 |
|
M S RGH |
0.0 |
0.0 |
10.8 |
0.0 |
0.0 |
0.0 |
0.0 |
0.0 |
|
L G BRN |
0.1 |
1.8 |
1.0 |
0.3 |
1.0 |
0.3 |
0.0 |
0.0 |
|
M&S BR |
0.1 |
0.3 |
4.1 |
0.2 |
0.2 |
0.1 |
0.0 |
0.0 |
|
L G MLD |
20.9 |
63.9 |
212.0 |
42.8 |
53.8 |
24.8 |
0.0 |
0.0 |
|
M S MLD |
5.2 |
49.1 |
41.4 |
5.2 |
34.7 |
12.3 |
0.0 |
0.0 |
|
TOTAL |
84.5 |
303.7 |
414.3 |
75.1 |
147.8 |
122.4 |
0.0 |
0.0 |
|
COTTON |
|
THOUSAND RUNNING BALES |
||||||
|
UPLAND |
188.0 |
8,070.1 |
5,871.1 |
157.4 |
440.8 |
536.2 |
4.4 |
1,320.7 |
|
PIMA |
7.5 |
219.3 |
191.2 |
7.6 |
17.8 |
10.3 |
0.0 |
24.9 |
Export Sales Highlights
This summary is based on reports from exporters for the period August 10-16, 2018.
Wheat: Net sales of 239,800 MT for 2018/2019 were down 70 percent from the previous week and 49 percent from the prior 4-week average. Increases were reported for Iraq (200,000 MT), Yemen (84,000 MT, including 79,000 MT switched from unknown destinations), Colombia (59,100 MT, including 6,000 MT switched from unknown destinations), Mexico (47,200 MT, including decreases of 4,200 MT), and the Philippines (24,000 MT). Reductions were for unknown destinations (95,200 MT), Indonesia (64,000 MT), Nigeria (37,000 MT), and Taiwan (16,300 MT). Exports of 460,300 MT were unchanged from the previous week and up 15 percent from the prior 4-week average. The destinations were primarily to Japan (142,100 MT), Yemen (84,000 MT), Indonesia (76,000 MT), Nigeria (49,700 MT), and Chile (45,000 MT).
Corn: Net sales of 173,400 MT for 2017/2018 were down 49 percent from the previous week and 55 percent from the prior 4-week average. Increases were reported for Japan (131,000 MT), Mexico (100,400 MT, including decreases of 3,600 MT), Colombia (78,000 MT, including 80,000 MT switched from unknown destinations and decreases of 53,300 MT), Indonesia (73,500 MT, including 68,000 MT switched from unknown destinations), and Saudi Arabia (70,500 MT, including 65,000 MT switched from unknown destinations). Reductions were primarily for unknown destinations (476,100 MT) and El Salvador (15,000 MT). For 2018/2019, net sales of 1,054,600 MT were reported for unknown destinations (403,700 MT), Mexico (280,200 MT), and Egypt (110,000 MT). Exports of 1,313,400 MT were up 8 percent from the previous week, but down 5 percent from the prior 4-week average. The destinations were primarily to Japan (363,600 MT), Mexico (273,600 MT), Colombia (145,200 MT), Taiwan (90,600 MT), and Indonesia (73,500 MT, all late reporting).
Optional Origin Sales: For 2018/2019, the current outstanding balance of 965,000 MT is for unknown destinations (298,000 MT), South Korea (412,000 MT), Vietnam (130,000 MT), Saudi Arabia (70,000 MT), and Malaysia (55,000 MT).
Barley: Net sales of 2,400 MT for 2018/2019 were for Japan (2,000 MT) and Vietnam (400 MT). Exports of 200 MT were to Japan.
Sorghum: Net sales of 11,400 MT for 2017/2018 were for China (57,200 MT, including 52,000 MT switched from unknown destinations), Mexico (5,100 MT), and Burma (1,100 MT). Reductions were reported for unknown destinations (52,000 MT). Exports of 61,300 MT were primarily to China (58,300 MT) and Mexico (3,000 MT).
Rice: Net sales of 84,500 MT for 2018/2019 were reported for Mexico (54,900 MT), Haiti (15,700 MT, including decreases of 100 MT), Honduras (2,700 MT), Libya (2,500 MT), and Saudi Arabia (2,400 MT). Exports of 75,100 MT were primarily to Haiti (30,400 MT), Mexico (24,800 MT), Saudi Arabia (8,700 MT), Panama (3,500 MT), and Canada (3,200 MT).
Soybeans: Net sales of 152,700 MT for 2017/2018 were up 14 percent from the previous week, but down 37 percent from the prior 4-week average. Increases were reported for Indonesia (88,700 MT, including 68,000 MT switched from unknown destinations), the Netherlands (85,900 MT, including 74,000 MT switched from unknown destinations), Germany (79,400 MT), Egypt (57,400 MT, switched from unknown destinations), and Spain (50,000 MT). Reductions were for unknown destinations (343,900 MT). For 2018/2019, net sales of 1,148,600 MT were reported for Mexico (403,100 MT), unknown destinations (360,000 MT), Taiwan (127,500 MT), and Thailand (91,000 MT). Exports of 626,500 MT were up 7 percent from the previous week, but down 18 percent from the prior 4-week average. The destinations included Indonesia (109,300 MT), the Netherlands (85,900 MT), Germany (79,400 MT), Pakistan (68,300 MT), and Egypt (57,400 MT).
Optional Origin Sales: For 2017/2018, options were exercised to export 66,000 MT to unknown destinations from other than the United States. For 2018/2019, the current outstanding balance of 63,000 MT is for unknown destinations.
Export for Own Account: The current exports for own account outstanding balance is 130,900 MT, all Canada.
Export Adjustments: Accumulated exports to the Netherlands were adjusted down 79,407 MT for week ending August 2nd. The correct destination is Germany and is included in this week’s report.
Soybean Cake and Meal: Net sales of 212,500 MT for 2017/2018 were up 3 percent from the previous week and 51 percent from the prior 4-week average. Increases were reported for the Philippines (86,300 MT), Mexico (68,600 MT, including decreases of 1,000 MT), the Dominican Republic (25,300 MT), Colombia (17,800 MT, including 9,000 MT switched from unknown destinations and decreases of 500 MT), and Japan (11,200 MT). Reductions were reported for Thailand (6,100 MT), Vietnam (2,600 MT), and unknown destinations (1,000 MT). For 2018/2019, net sales of 109,300 MT were reported for the Philippines (45,300 MT), Vietnam (41,800 MT), and Canada (6,400 MT). Exports of 184,500 MT were down 12 percent from the previous week and 21 percent from the prior 4-week average. The primary destinations were Thailand (53,300 MT), Mexico (40,800 MT), the Philippines (26,200 MT), Indonesia (15,700 MT), and Vietnam (14,100 MT).
Soybean Oil: Net sales of 5,200 MT for 2017/2018 were up 7 percent from the previous week, but down 19 percent from the prior 4-week average. Increases reported for Morocco (12,000 MT, switched from unknown destinations), Mexico (2,600 MT), the Dominican Republic (1,200 MT), Peru (600 MT), and Guatemala (500 MT), were partially offset by reductions for unknown destinations (12,000 MT). For 2018/2019, net sales of 1,100 MT were reported for Mexico (800 MT) and the Dominican Republic (300 MT). Exports of 14,400 MT were down 16 percent from the previous week and 34 percent from the prior 4-week average. The primary destinations were Morocco (11,800 MT), Mexico (2,200 MT), and Canada (300 MT).
Cotton: Net sales of 188,000 RB for 2018/2019 were reported for Vietnam (73,000 RB, including 6,600 RB switched from Japan, 900 RB switched from Taiwan, 800 RB switched from South Korea, and 200 RB switched from Indonesia), Malaysia (43,400 RB, including 700 RB switched from Japan), Pakistan (27,500 RB, including decreases of 1,900 RB), Indonesia (22,100 RB, including 9,000 RB switched from Japan), and Peru (10,800 RB). Reductions were reported for Japan (17,300 RB). For 2019/2020, net sales of 4,400 RB were reported for China. Exports of 157,400 RB were primarily to Vietnam (45,700 RB), Turkey (22,100 RB), China (18,600 RB), Mexico (14,300 RB), and Indonesia (13,200 RB). Net sales of Pima totaling 7,500 RB for 2018/2019 were reported for India (4,300 RB, including decreases of 100 RB), Thailand (1,000 RB), China (900 RB), and Turkey (900 RB). Reductions were reported for Switzerland (100 RB). Exports of 7,600 RB were primarily to India (3,800 RB), Vietnam (1,300 RB), Thailand (900 RB), and Egypt (700 RB).
Optional Origin Sales: For 2018/2019, the current optional origin outstanding balance of 6,200 RB is for Indonesia (4,400 RB) and Vietnam (1,800 RB).
Exports for Own Account: New exports for own account totaling 100 RB were to Vietnam. Exports for own account totaling 5,600 RB were applied to new or outstanding sales to Japan (5,500 RB) and Vietnam (100 RB). Decreases totaling 100 RB were reported for China. The current outstanding balance is 5,100 RB, all China.
Hides and Skins: Net sales of 387,100 pieces reported for 2018 were up 10 percent from the previous week, but down 28 percent from the prior 4-week average. Whole cattle hide sales totaling 387,400 pieces were primarily for China (176,500 pieces, including decreases of 3,500 pieces), South Korea (107,700 pieces, including decreases of 2,000 pieces), Mexico (84,900 pieces, including decreases of 200 pieces), Thailand (8,900 pieces, including decreases of 4,000 pieces), and Brazil (3,800 pieces, including decreases of 300 pieces). Exports of 418,100 pieces reported for 2018 were down 2 percent from the previous week, but up 5 percent from the prior 4-week average. Whole cattle hide exports of 415,700 pieces were primarily to China (185,500 pieces), South Korea (112,400 pieces), Thailand (62,000 pieces), Mexico (31,700 pieces), and Japan (6,900 pieces).
Net sales of 53,100 wet blues for 2018 were down 64 percent from the previous week and 61 percent from the prior 4-week average. Increases were reported for Vietnam (19,200 unsplit and 4,500 grain splits), the Dominican Republic (11,900 unsplit), China (8,500 unsplit), and Mexico (4,800 unsplit and 3,600 grain splits). Reductions were reported for Italy (800 unsplit and 500 grain splits). For 2019, net sales of 78,000 wet blues were reported for Italy. Exports of 114,200 wet blues for 2018 were down 45 percent from the previous week and 31 percent from the prior 4-week average. The primary destinations were Italy (32,800 unsplit and 8,800 grain splits), China (34,700 unsplit), Vietnam (12,000 unsplit), the Dominican Republic (8,700 unsplit), and Thailand (4,000 unsplit and 3,800 grain splits). Net sales splits totaling of 150,400 pounds for 2018 resulted as increases for Vietnam (193,200 pounds), were partially offset by reductions for China (42,800 pounds). Exports of 494,400 pounds were down 31 percent from the previous week, but up 8 percent from the prior 4-week average. The destinations were Vietnam (323,100 pounds), South Korea (120,000 pounds), and China (51,300 pounds).
Beef: Net sales of 20,600 MT for 2018 were down 4 percent from the previous week, but up 45 percent from the prior 4-week average. Increases were primarily for Japan (6,800 MT, including decreases of 300 MT), Hong Kong (4,600 MT, including decreases of 100 MT), South Korea (4,000 MT, including decreases of 500 MT), Mexico (1,400 MT, including decreases of 400 MT), and Vietnam (1,400 MT). Exports of 16,900 MT were unchanged from the previous week, but down 6 percent from the prior 4-week average. The primary destinations were Japan (5,500 MT), South Korea (4,300 MT), Mexico (2,000 MT), Hong Kong (1,600 MT), and Taiwan (1,500 MT).
Pork: Net sales of 26,800 MT for 2018 were unchanged from the previous week, but down 1 percent from the prior 4-week average. Increases were reported for Mexico (10,300 MT), Canada (4,200 MT), Colombia (3,300 MT), Japan (3,100 MT), and South Korea (2,500 MT). Exports of 20,900 MT were up 7 percent from the previous week and 16 percent from the prior 4-week average. The primary destinations were Mexico (8,000 MT), Japan (3,700 MT), South Korea (2,400 MT), Canada (2,100 MT), and Hong Kong (1,500 MT).
August 23, 2018 1 FOREIGN AGRICULTURAL SERVICE/USDA
SUMMARY OF EXPORT TRANSACTION
REPORTED UNDER THE DAILY REPORTING SYSTEM
FOR PERIOD ENDING AUGUST 16, 2018
COMMODITY DESTINATION QUANTITY MARKETING YEAR
CORN UNKNOWN 55,000 MT 1/ 2017/2018
CORN UNKNOWN 59,572 MT 1/ 2018/2019
SOYBEANS MEXICO 294,904 MT 1/ 2018/2019
WHEAT (HRW) IRAQ 200,000 MT 1/ 2018/2019
1/ Export sales.
Terry Reilly
Senior Commodity Analyst – Grain and Oilseeds
Futures International │190 S LaSalle St., Suite 410│Chicago, IL 60603
W: 312.604.1366
AIM: fi_treilly
ICE IM: treilly1
Skype: fi.treilly

Trading of futures, options, swaps and other derivatives is risky and is not suitable for all persons. All of these investment products are leveraged, and you can lose more than your initial deposit. Each investment product is offered only to and from jurisdictions where solicitation and sale are lawful, and in accordance with applicable laws and regulations in such jurisdiction. The information provided here should not be relied upon as a substitute for independent research before making your investment decisions. Futures International, LLC is merely providing this information for your general information and the information does not take into account any particular individual’s investment objectives, financial situation, or needs. All investors should obtain advice based on their unique situation before making any investment decision. The contents of this communication and any attachments are for informational purposes only and under no circumstances should they be construed as an offer to buy or sell, or a solicitation to buy or sell any future, option, swap or other derivative. The sources for the information and any opinions in this communication are believed to be reliable, but Futures International, LLC does not warrant or guarantee the accuracy of such information or opinions. Futures International, LLC and its principals and employees may take positions different from any positions described in this communication. Past results are not necessarily indicative of future results.