From: Terry Reilly
Sent: Thursday, September 27, 2018 7:45:50 AM (UTC-06:00) Central Time (US & Canada)
Subject: FI Weekly USDA Export Sales Snapshot 09/27/18
See text below and attached PDF
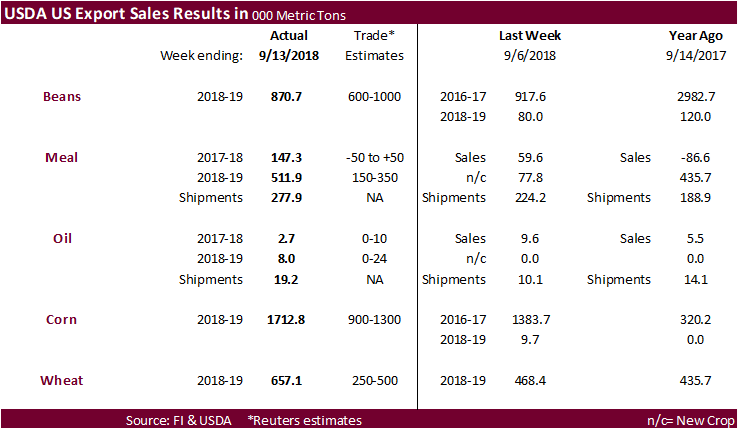
USDA export sales were good for meal, corn, wheat, soybeans and slow for soybean oil.
2018-19 soybean meal sales were 511,900 tons.
2018-19 corn export sales of 1.713 million tons were well above expectations.
Soybean export sales of 870,700 tons were within expectations and includes 96,100 tons for Argentina.
All-wheat export sales were 657,100 tons, an improvement from 468,400 tons from last week.
Soybean oil export sales were poor at 2,700 tons and there were 8,000 tons booked for 2018-19.
Prior to USDA export sales, soybeans and meal were slightly higher on US harvesting delays and negative fundamental comments over US soybeans at a conference in Asia, despite a lower lead by offshore values for CBOT soybean meal by $2.10/short ton. WTI is higher and limiting losses in corn and soybean oil. Wheat was mostly under pressure on improving global weather conditions (Europe and CIS).
Post export sales report, prices slightly recovered in wheat and soybeans traded 1-1.5 cents higher. Corn recovered to trade higher.
· US Durables Goods Aug: 4.5% (est 2.0%, prev R -1.2%)
– US Durables Ex-Transport Aug:0.1% (est 0.5%, prev R 0.2%)
– US Durables Ex-Defence (MM)(Aug): 2.6% (prev R -0.6%%)
– US Non Def Cap Ex-Air (Aug): -0.5% (est 0.4%, prev R 1.5%)
· US GDP Final Q2: 4.2% (est 4.2%, prev 4.2%)
– US GDP Cons Spending Final Q2: 3.8% (prev 3.8%)
– US GDP Deflator Final Q2: 3.3% (est 3.0%, prev 3.2%)
· US Core PCE Prices Final Q2: 2.1% (est 2.0%, prev 2.0%)
· US PCE Prices Final Q2: 2.0% (est 1.9%, prev 1.9%)
· US Adv Goods Trade Balance Aug; -75.83Bln (prev -72.05Bln)
· US Wholesale Inventories Adv Aug: 0.8% (prev 0.6%)
· US Initial Jobless Claims: 214K (est 210K, prev R 202K)
· US Jobless Claims 4-WK Avg: 206.25K (prev R 206K)
· US Continue Jobless Claims: 1.661M (est 1.684M, prev 1.645M)
· US Durables Goods Aug: 4.5% (est 2.0%, prev R -1.2%)
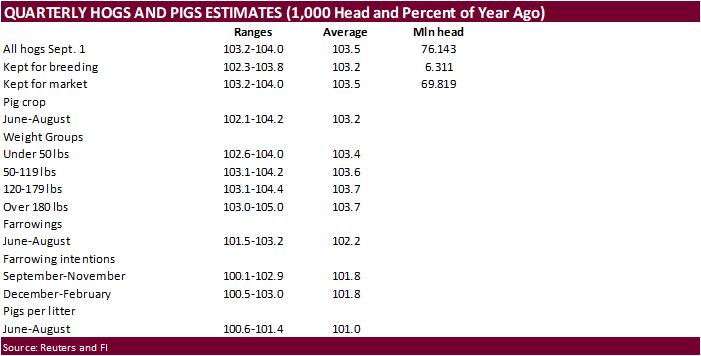
US Hogs and Pigs are due out this afternoon.
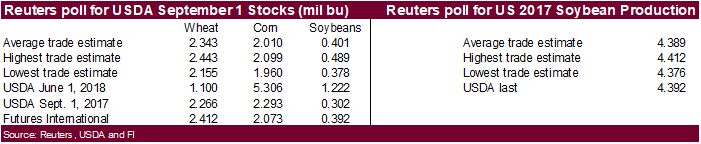
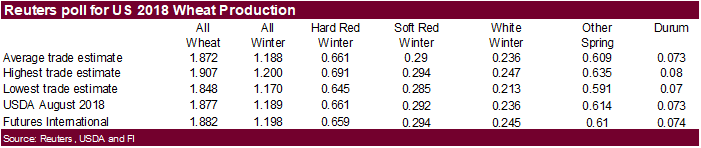
USDA due out on Friday with September 1 grain stocks, possible revision to 2017 US soybean production, and small grains summery that updates the US 2018 wheat crop output.
· Ethanol down 103 to 436
U.S. EXPORT SALES FOR WEEK ENDING 9/20/2018
|
|
CURRENT MARKETING YEAR |
NEXT MARKETING YEAR |
||||||
|
COMMODITY |
NET SALES |
OUTSTANDING SALES |
WEEKLY EXPORTS |
ACCUMULATED EXPORTS |
NET SALES |
OUTSTANDING SALES |
||
|
CURRENT YEAR |
YEAR |
CURRENT YEAR |
YEAR |
|||||
|
|
THOUSAND METRIC TONS |
|||||||
|
WHEAT |
|
|
|
|
|
|
|
|
|
HRW |
175.7 |
1,384.9 |
1,450.6 |
187.2 |
1,755.6 |
3,614.4 |
0.0 |
0.0 |
|
SRW |
96.5 |
635.5 |
543.2 |
14.3 |
721.6 |
788.6 |
0.0 |
0.0 |
|
HRS |
244.9 |
1,419.6 |
1,383.0 |
174.5 |
1,912.7 |
2,268.0 |
0.0 |
0.0 |
|
WHITE |
129.5 |
1,118.1 |
1,376.9 |
49.9 |
1,649.3 |
1,842.1 |
0.0 |
0.0 |
|
DURUM |
10.5 |
123.0 |
101.8 |
57.8 |
144.0 |
149.8 |
0.0 |
0.0 |
|
TOTAL |
657.1 |
4,681.2 |
4,855.5 |
483.7 |
6,183.2 |
8,663.0 |
0.0 |
0.0 |
|
BARLEY |
2.1 |
41.7 |
27.3 |
0.9 |
13.8 |
9.6 |
0.0 |
0.0 |
|
CORN |
1,712.8 |
15,104.3 |
9,204.4 |
1,358.8 |
3,163.7 |
2,145.7 |
-9.7 |
71.1 |
|
SORGHUM |
0.0 |
61.8 |
914.0 |
1.3 |
3.9 |
283.1 |
0.0 |
0.0 |
|
SOYBEANS |
870.7 |
16,287.2 |
19,232.9 |
819.2 |
2,515.9 |
3,081.7 |
1.5 |
81.5 |
|
SOY MEAL |
147.3 |
882.0 |
529.4 |
277.8 |
11,858.8 |
9,899.5 |
511.9 |
2,523.0 |
|
SOY OIL |
2.7 |
76.0 |
50.2 |
19.2 |
998.2 |
1,089.0 |
8.0 |
63.6 |
|
RICE |
|
|
|
|
|
|
|
|
|
L G RGH |
79.4 |
255.4 |
118.0 |
0.1 |
152.6 |
185.9 |
0.0 |
0.0 |
|
M S RGH |
0.0 |
4.7 |
12.1 |
0.0 |
0.0 |
0.0 |
0.0 |
0.0 |
|
L G BRN |
1.1 |
5.6 |
1.2 |
0.3 |
2.7 |
1.0 |
0.0 |
0.0 |
|
M&S BR |
30.1 |
30.2 |
4.1 |
0.0 |
0.7 |
0.3 |
0.0 |
0.0 |
|
L G MLD |
13.4 |
119.9 |
145.8 |
4.2 |
105.3 |
138.4 |
0.0 |
0.0 |
|
M S MLD |
14.5 |
26.7 |
57.9 |
3.5 |
77.7 |
38.9 |
0.0 |
0.0 |
|
TOTAL |
138.5 |
442.5 |
339.1 |
8.1 |
339.0 |
364.6 |
0.0 |
0.0 |
|
COTTON |
|
THOUSAND RUNNING BALES |
||||||
|
UPLAND |
70.3 |
7,789.2 |
5,960.5 |
138.9 |
1,214.2 |
1,272.9 |
58.2 |
1,479.1 |
|
PIMA |
7.3 |
227.6 |
260.5 |
4.8 |
47.1 |
30.9 |
0.0 |
25.3 |
Export Sales Highlights
This summary is based on reports from exporters for the period September 14-20, 2018.
Wheat: Net sales of 657,100 metric tons for 2018/2019 were up 40 percent from the previous week and 59 percent from the prior 4-week average. Increases were reported for Japan (140,600 MT), the Philippines (94,400 MT, including 30,000 MT switched from unknown destinations), Mexico (91,100 MT, including decreases of 700 MT), unknown destinations (88,200 MT), and Venezuela (60,000 MT, including 30,000 MT switched from Uruguay). Reductions were for Uruguay (30,000 MT), French West Indies (13,000 MT), and Taiwan (11,800 MT). Exports of 483,700 MT–a marketing-year high–were up 54 percent from the previous week and 35 percent from the prior 4-week average. The destinations were primarily to Mexico (79,400 MT), Italy (59,400 MT), Thailand (58,200 MT), Taiwan (48,800 MT), and Guatemala (40,000 MT).
Corn: Net sales of 1,712,800 MT for 2018/2019 were reported for Mexico (623,200 MT, including decreases of 4,100 MT), Guatemala (161,400 MT), Japan (124,500 MT, including 124,000 MT switched from unknown destinations and decreases of 70,400 MT), Egypt (110,500 MT, including 55,000 MT switched from unknown destinations), and Peru (92,900 MT, including 21,500 MT switched from unknown destinations and decreases of 1,000 MT). Reductions were reported for Vietnam (60,000 MT), Nicaragua (6,800 MT), and Jamaica (1,500 MT). For 2019/2020, net sales reductions of 9,700 MT were reported for Mexico. Exports of 1,358,800 MT were primarily to Mexico (342,700 MT), Japan (272,500 MT), Egypt (163,500 MT), Taiwan (139,300 MT), and South Korea (129,700 MT).
Optional Origin Sales: For 2018/2019, new optional origin sales of 68,000 MT were reported for South Korea. The current outstanding balance of 1,157,000 MT is for South Korea (549,000 MT), unknown destinations (353,000 MT), Vietnam (130,000 MT), Saudi Arabia (70,000 MT), and Malaysia (55,000 MT).
Barley: Net sales of 2,100 MT for 2018/2019 were for South Korea (1,600 MT) and Taiwan (500 MT). Exports 900 MT were primarily to Japan.
Sorghum: No net sales were reported for the week. Exports of 1,300 MT were reported to Mexico.
Rice: Net sales of 138,500 MT for 2018/2019–a marketing-year high–were up noticeably from the previous week and from the prior 4-week average. Increases were reported for Mexico (49,500 MT), South Korea (30,000 MT), Honduras (28,000 MT), Japan (12,000 MT), and Togo (6,500 MT). Exports of 8,100 MT–a marketing-year low–were down 84 percent from the previous week and 82 percent from the prior 4-week average. The primary destinations were Canada (2,200 MT), Jordan (1,600 MT), Honduras (1,000 MT), Mexico (900 MT), and Saudi Arabia (800 MT).
Export for Own Account: New exports for own account totaling 100 MT were reported to Canada. The current exports for own account outstanding balance is 100 MT, all Canada.
Soybeans: Net sales of 870,700 MT for 2018/2019 were reported for unknown destinations (351,700 MT), Spain (104,600 MT, including 100,000 MT switched from unknown destinations), the Netherlands (103,200 MT, including 96,000 MT switched from unknown destinations), Argentina (96,100 MT, including 40,000 MT switched from unknown destinations and decreases of 4,200 MT), and Japan (61,500 MT, including 24,700 MT switched from unknown destinations and decreases of 2,000 MT). Reductions were reported for China (64,000 MT), Egypt (3,200 MT), and Costa Rica (200 MT). For 2019/2020, net sales of 1,500 MT were reported for Japan. Exports of 819,200 MT were primarily to Spain (104,600 MT), Mexico (103,300 MT), the Netherlands (103,200 MT), Egypt (81,800 MT), and Saudi Arabia (72,000 MT).
Optional Origin Sales: For 2018/2019, new optional origin sales of 60,000 MT were reported for unknown destinations. The current outstanding balance of 123,000 MT is unknown destinations.
Export for Own Account: The current exports for own account outstanding balance is 61,600 MT, all Canada.
Soybean Cake and Meal: Net sales of 147,300 MT for 2017/2018 were up noticeably from the previous week and from the prior 4-week average. Increases were reported for Vietnam (42,900 MT, including decreases of 200 MT), Japan (24,400 MT, including 2,900 MT switched from unknown destinations), the Philippines (20,200 MT), Canada (17,800 MT), and Mexico (11,200 MT, including decreases of 1,200 MT). Reductions were reported for Thailand (3,000 MT), Costa Rica (700 MT), and Jamaica (700 MT). For 2018/2019, net sales of 511,900 MT were reported for unknown destinations (179,400 MT), Guatemala (77,000 MT), the Dominican Republic (54,000 MT), and Indonesia (54,000 MT). Exports of 277,800 MT were up 24 percent from the previous week and 31 percent from the prior 4-week average. The primary destinations were the Philippines (114,900 MT), Mexico (36,100 MT), Colombia (27,000 MT), Canada (26,100 MT), and the Dominican Republic (23,500 MT).
Soybean Oil: Net sales of 2,700 MT for 2017/2018 were down 72 percent from the previous week and 69 percent from the prior 4-week average. Increases were reported for Mexico (1,000 MT), El Salvador (700 MT), Colombia (500 MT), and Canada (300 MT). For 2018/2019, net sales of 8,000 MT were reported for South Korea (4,500 MT), the Dominican Republic (2,500 MT), and Colombia (1,000 MT). Exports of 19,200 MT were up 91 percent from the previous week and 16 percent from the prior 4-week average. The primary destinations were the Dominican Republic (9,500 MT), Guatemala (4,500 MT), Jamaica (3,000 MT), and Mexico (1,800 MT).
Cotton: Net sales of 70,300 RB for 2018/2019–a marketing-year low–were down 28 percent from the previous week and 33 percent from the prior 4-week average. Increases were reported for Vietnam (36,300 RB, including 3,800 RB switched from China), Japan (13,900 RB, including decreases of 1,800 RB), Pakistan (13,800 RB), Taiwan (11,900 RB, including 1,000 RB switched from Japan and 600 RB switched from China), and Guatemala (6,700 RB). Reductions were reported for China (46,800 RB). For 2019/2020, net sales of 58,200 RB were reported for China (56,400 RB) and Thailand (1,800 RB). Exports of 138,900 RB were down 7 percent from the previous week and 13 percent from the prior 4-week average. Exports were primarily to Vietnam (34,600 RB), Bangladesh (17,900 RB), Mexico (15,000 RB), Indonesia (14,900 RB), and China (12,900 RB). Net sales of Pima totaling 7,300 RB for 2018/2019 were up noticeably from the previous week, but down 4 percent from the prior 4-week average. Increases reported for China (2,200 RB), Peru (2,200 RB), India (1,100 RB), and Thailand (900 RB), were partially offset by reductions for Japan (100 RB). Exports of 4,800 RB were down 45 percent from the previous week and 22 percent from the prior 4-week average. The primary destinations were India (2,700 RB), Egypt (900 RB), and Peru (800 RB).
Optional Origin Sales: For 2018/2019, new optional origin sales of 600 RB were reported for Pakistan. Options were exercised to export 600 RB to Pakistan from the United States. The current outstanding balance of 1,800 RB is for Vietnam.
Exports for Own Account: The current exports for own account outstanding balance is 7,400 RB, all China.
Hides and Skins: Net sales of 340,200 pieces reported for 2018 were down 43 percent from the previous week and 18 percent from the prior 4-week average. Whole cattle hide sales totaling 339,200 pieces were primarily for China (214,000 pieces, including decreases of 15,600 pieces), South Korea (54,200 pieces, including decreases of 4,100 pieces), Mexico (39,100 pieces, including decreases of 300 pieces), Taiwan (7,900 pieces, including decreases of 800 pieces), and Brazil (6,900 pieces, including decreases of 400 pieces). Exports of 439,200 pieces reported for 2018 were down 10 percent from the previous week and 4 percent from the prior 4-week average. Whole cattle hide exports of 433,800 pieces were primarily to China (239,300 pieces), South Korea (115,500 pieces), Mexico (41,300 pieces), Indonesia (8,000 pieces), and Taiwan (7,700 pieces).
Net sales of 82,400 wet blues for 2018 were up 76 percent from the previous week, but down 33 percent from the prior 4-week average. Increases were reported for Vietnam (21,800 unsplit and 100 grain splits), Taiwan (21,800 unsplit), China (21,400 unsplit), and Mexico (13,600 grain splits and 100 unsplit). Reductions were reported for Italy (4,900 unsplit) and Hong Kong (400 grain splits). Exports of 144,800 wet blues for 2018 were up 10 percent from the previous week and 3 percent from the prior 4-week average. The primary destinations were China (57,800 unsplit), Italy (34,700 unsplit and 5,400 grain splits), Vietnam (16,700 unsplit and 4,800 grain splits), and Mexico (11,200 grain splits and 3,300 unsplit). Net sales of splits totaling 98,300 pounds for 2018 were reported for China (50,000 pounds), Vietnam (43,400 pounds), and Mexico (4,900 pounds). Exports of 161,900 pounds for 2018 were down 60 percent from the previous week and 71 percent from the prior 4-week average. The destinations were Vietnam (157,000 pounds) and Mexico (4,900 pounds).
Beef: Net sales of 16,000 MT reported for 2018 were up 1 percent from the previous week, but down 10 percent from the prior 4-week average. Increases were reported for South Korea (4,800 MT, including decreases of 400 MT), Japan (4,500 MT, including decreases of 600 MT), Mexico (1,900 MT, including decreases of 100 MT), Canada (1,500 MT, including decreases of 100 MT), and Hong Kong (1,500 MT, including decreases of 200 MT). For 2019, net sales of 400 MT were reported for South Korea (300 MT) and Taiwan (100 MT). Exports of 16,200 MT were down 7 percent from the previous week and 5 percent from the prior 4-week average. The primary destinations were South Korea (4,300 MT), Japan (4,200 MT), Mexico (1,900 MT), Hong Kong (1,800 MT), and Canada (1,300 MT).
Pork: Net sales of 28,300 MT reported for 2018 were up 24 percent from the previous week and 26 percent from the prior 4-week average. Increases were reported primarily for Mexico (18,200 MT), Japan (3,200 MT), Canada (2,200 MT), South Korea (1,700 MT), and Hong Kong (900 MT). Reductions were reported for Colombia (100 MT). For 2019, net sales of 2,300 MT were primarily for Australia (1,900 MT) and South Korea (300 MT). Exports of 17,600 MT were down 15 percent from the previous week and from the prior 4-week average. The primary destinations were Mexico (7,200 MT), Japan (3,000 MT), Hong Kong (1,700 MT), Canada (1,500 MT), and South Korea (1,500 MT).
September 27, 2018 1 FOREIGN AGRICULTURAL SERVICE/USDA
REPORTED UNDER THE DAILY REPORTING SYSTEM
FOR PERIOD ENDING SEPTEMBER 20, 2018
COMMODITY DESTINATION QUANTITY MARKETING YEAR
CORN MEXICO 160,020 MT 1/ 2018/2019
CORN UNKNOWN 121,700 MT 1/ 2018/2019
SOYBEANS UNKNOWN 241,000 MT 1/ 2018/2019
SOYBEAN CAKE AND MEAL UNKNOWN 100,000 MT 1/ 2018/2019
1/ Export sales.
Terry Reilly
Senior Commodity Analyst – Grain and Oilseeds
Futures International │190 S LaSalle St., Suite 410│Chicago, IL 60603
W: 312.604.1366
AIM: fi_treilly
ICE IM: treilly1
Skype: fi.treilly

Trading of futures, options, swaps and other derivatives is risky and is not suitable for all persons. All of these investment products are leveraged, and you can lose more than your initial deposit. Each investment product is offered only to and from jurisdictions where solicitation and sale are lawful, and in accordance with applicable laws and regulations in such jurisdiction. The information provided here should not be relied upon as a substitute for independent research before making your investment decisions. Futures International, LLC is merely providing this information for your general information and the information does not take into account any particular individual’s investment objectives, financial situation, or needs. All investors should obtain advice based on their unique situation before making any investment decision. The contents of this communication and any attachments are for informational purposes only and under no circumstances should they be construed as an offer to buy or sell, or a solicitation to buy or sell any future, option, swap or other derivative. The sources for the information and any opinions in this communication are believed to be reliable, but Futures International, LLC does not warrant or guarantee the accuracy of such information or opinions. Futures International, LLC and its principals and employees may take positions different from any positions described in this communication. Past results are not necessarily indicative of future results.
This email, any information contained herein and any files transmitted with it (collectively, the Material) are the sole property of OTC Global Holdings LP and its affiliates (OTCGH); are confidential, may be legally privileged and are intended solely for the use of the individual or entity to whom they are addressed. Unauthorized disclosure, copying or distribution of the Material, is strictly prohibited and the recipient shall not redistribute the Material in any form to a third party. Please notify the sender immediately by email if you have received this email by mistake, delete this email from your system and destroy any hard copies. OTCGH waives no privilege or confidentiality due to any mistaken transmission of this email.